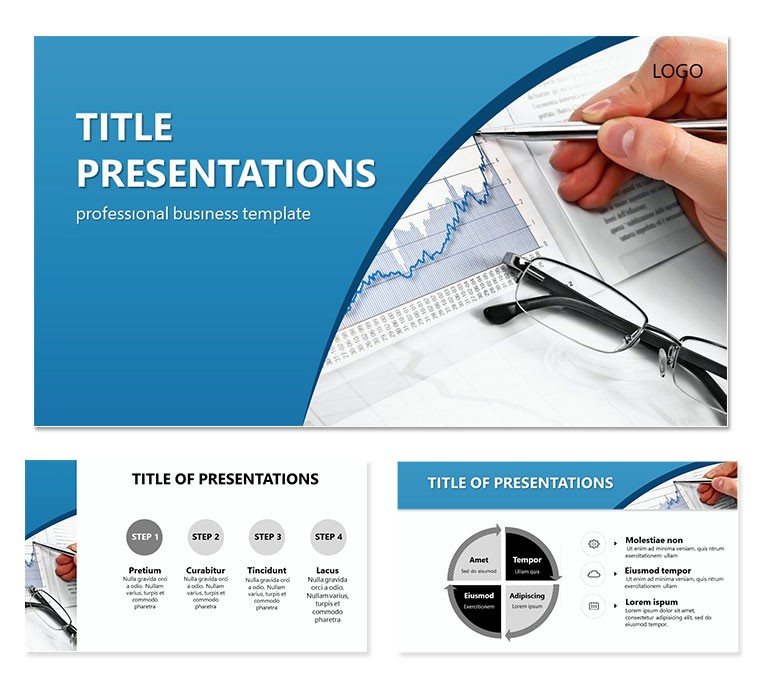
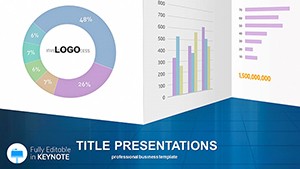
Imagine stepping into a boardroom where your price forecasts don`t just inform - they captivate. That`s the power of the Graphical Price Analysis Keynote Template, crafted for financial professionals who need to turn complex market data into visuals that resonate. Whether you`re a seasoned analyst breaking down quarterly trends or a consultant pitching investment strategies, this template streamlines your workflow with 28 ready-to-edit diagrams across seven vibrant color schemes. Compatible with Keynote on macOS, it offers three master slides and three background options, ensuring your deck aligns seamlessly with your brand`s aesthetic.
At its core, this template addresses the frustration of starting from scratch in Keynote. No more wrestling with basic charts that look dated; instead, dive into pre-built elements like line graphs for price trajectories, bar comparisons for competitor pricing, and pie charts that highlight market shares. Each diagram is vector-based, scalable without losing quality, and fully editable - swap data points with a click, tweak fonts to match your style guide, or layer in icons for that extra polish. It`s designed for those high-stakes moments, like presenting to stakeholders who demand clarity amid volatility.
Unlocking Key Features for Impactful Presentations
Let`s break down what makes this template a game-changer. Start with the seven color schemes, each inspired by financial palettes: from cool blues for stability to bold reds for alerts on declines. These aren`t arbitrary; they`re chosen to evoke trust and urgency, much like how Bloomberg terminals use color to signal market shifts. With three masters, you can switch layouts effortlessly - title slides for intros, content pages for deep dives, and closers for calls to action.
- 28 Editable Diagrams: From scatter plots tracking price elasticity to timelines mapping historical fluctuations, every slide is a building block for your narrative.
- Intuitive Customization: Drag-and-drop elements mean you spend less time formatting and more on insights. Add animations to reveal data progressively, keeping your audience hooked.
- Brand Integration: Import your logo, adjust gradients on backgrounds, and ensure consistency across your deck.
One user, a hedge fund manager, shared how swapping in real-time forex data turned a routine update into a persuasive pitch that secured buy-in from the C-suite. It`s these practical tweaks that elevate ordinary reports to strategic tools.
Step-by-Step: Building Your First Price Analysis Deck
- Select Your Scheme: Open the template in Keynote and choose a color palette that matches your report`s tone - say, greens for growth projections.
- Input Data: Click into the first diagram, a multi-line graph, and paste your CSV-exported price history. Keynote auto-scales axes for accuracy.
- Layer Insights: Add callouts with text boxes to annotate spikes, like "Q2 Surge: +15% YoY," drawing eyes to your key takeaway.
- Preview and Polish: Use Keynote`s presenter view to rehearse transitions, ensuring smooth flow from overview to details.
- Export and Share: Save as PDF for handouts or link to collaborative editing for team reviews.
This process, honed for efficiency, lets you craft a 20-slide deck in under an hour - far quicker than piecing together from defaults.
Real-World Applications in Finance and Beyond
Beyond spreadsheets, this template shines in diverse scenarios. For commodity traders, use the funnel diagrams to illustrate supply chain pricing bottlenecks, visualizing how raw material costs ripple to end-user prices. In consulting, adapt the radar charts for competitive benchmarking, showing how your client`s pricing stacks up against rivals. Even in non-finance roles, like marketing teams analyzing ad spend ROI, the flexible layouts prove invaluable.
Consider a scenario in economic forecasting: Layer weather impact data onto price curves to demonstrate correlations, turning abstract models into tangible stories. Or, for startup founders pitching VCs, highlight burn rate projections with stacked bars, underscoring scalability. The template`s versatility stems from its focus on clarity - every element serves to simplify, not complicate.
Tips for Maximizing Visual Impact
To truly stand out, pair diagrams with minimal text: Aim for the 10-20-30 rule - 10 slides, 20 minutes, 30-point font. Experiment with opacity on overlays to blend data layers without clutter. And remember, consistency in icons (included in the pack) reinforces themes, like currency symbols for global markets.
Compared to stock Keynote charts, this template offers thematic cohesion - no mismatched styles that dilute your message. It`s like upgrading from a sketchpad to a blueprint: precise, professional, and poised for persuasion.
Why This Template Fits Your Workflow
Engineered for Keynote users who value speed without sacrificing sophistication, it integrates with tools like Numbers for seamless data pulls. Whether you`re on a MacBook during travel or iPad for quick edits, the responsive design holds up. Plus, with lifetime access post-download, updates ensure compatibility with future Keynote versions.
Download the Graphical Price Analysis Keynote Template today for $22 and start visualizing victory. Your next presentation isn`t just data - it`s a dialogue that drives decisions.
Frequently Asked Questions
What software is required to use this template?
This template is optimized for Apple Keynote (version 2016 and later) on macOS or iOS devices.
Can I customize the colors beyond the seven schemes?
Yes, all elements are fully editable; use Keynote`s color picker to match your exact brand palette.
Are animations included in the diagrams?
Basic build-in animations are pre-set, but you can add or modify them via Keynote`s animate tab for custom effects.
How many slides come with the template?
It includes 28 diagram-focused slides, plus master layouts for expansion.
Is it compatible with Google Slides?
While designed for Keynote, you can export to PowerPoint format for Google Slides import, though some animations may adjust.
What file formats are provided upon download?
You`ll receive .key files for Keynote, plus .jpg previews for quick reference.