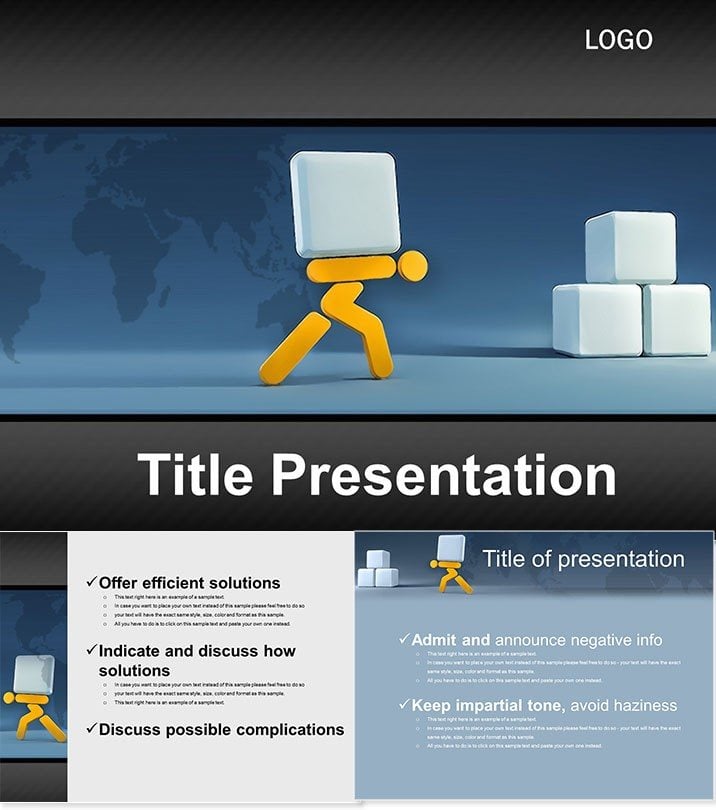
Picture your team`s processes flowing like a well-oiled machine, captured vividly on screen - that`s the essence of the Workflow in Business Keynote template. Designed for business leaders navigating complex operations, this tool turns abstract workflows into tangible, easy-to-follow diagrams that drive decisions and alignment. From startup pitches to enterprise audits, these slides help you illustrate every step, ensuring stakeholders grasp the big picture without the fog of confusion.
Crafted with professionals in mind, this template boasts 28 diagrams spanning flowcharts, process maps, and hierarchical charts, all compatible with Keynote 2016+. Three master layouts and backgrounds provide a solid foundation, while seven color schemes let you infuse your corporate identity seamlessly. Managers and analysts praise its intuitive setup, which cuts prep time in half compared to starting from scratch, letting you focus on strategy over styling. It`s more than slides; it`s a visual language for efficiency.
Envision a project manager unveiling a new initiative: the sequence diagrams trace tasks from ideation to execution, highlighting bottlenecks before they arise. Or a consultant diagramming supply chain logistics, where Gantt-style timelines reveal synchronization points. This template`s strength lies in its adaptability - swap in real metrics effortlessly, and watch your narrative gain momentum. Why settle for static reports when you can download this template now and animate your business story?
Standout Features for Seamless Workflows
Explore the toolkit that powers productive presentations. With 28 targeted diagrams, it addresses core business needs like decision trees and cycle illustrations, optimized for both 16:9 and 4:3 ratios.
- Process-Focused Diagrams: Detailed flow maps and swimlane charts to delineate roles and responsibilities clearly.
- Quick Edits: Placeholder data is primed for your inputs, with smart guides for precise alignments.
- Themed Backgrounds: Three options, from minimalist whites to subtle gradients, keeping focus on content.
- Palette Variety: Seven schemes, including corporate blues and energetic greens, for versatile branding.
In practice, teams using these features report heightened collaboration, as visuals bridge communication gaps in remote meetings.
Real-World Applications in Business
This template excels across sectors, from tech firms mapping agile sprints to retail ops detailing inventory cycles. A sales director might employ the funnel diagrams to forecast revenue pipelines, turning data dumps into strategic insights. In education for business courses, instructors use it to simulate organizational structures, helping students visualize real corporate dynamics.
Think of a logistics coordinator presenting route optimizations: the network diagrams connect dots geographically, revealing cost savings. Unlike Keynote`s vanilla charts, which lack depth for interconnected processes, this offers layered vectors that zoom without losing detail. Non-profits benefit too, diagramming grant allocations to donors transparently. Users like a Fortune 500 ops lead note how it clarified a merger integration, averting missteps worth thousands.
Superior to Standard Keynote Tools
Default Keynote serves basics well, but for workflow intricacies, it falls short - manual linking of shapes often leads to misalignment. This template`s pre-linked elements and auto-formatting ensure polish from slide one. Where defaults cap at simple lines, here you get sophisticated connectors that adapt to data changes dynamically. The result? Presentations that not only inform but inspire action, with far less effort.
Transform Your Decks Effortlessly
Invest in clarity that propels your business forward. Lifetime license means endless use; grab it today and redefine how you present processes.
Frequently Asked Questions
Why choose this for workflow presentations?
It specializes in business diagrams like flowcharts, making operational explanations intuitive and engaging.
Supported Keynote versions?
Fully compatible from 2016 onward, with cross-device support via iCloud.
Can diagrams be expanded?
Yes, duplicate and modify the 28 slides to fit unique process needs.
Color customization details?
Seven built-in schemes, editable for exact brand matches.
Download formats?
Includes .key, .kth, and .jpg for versatile access.
Masters included?
Three, fully editable for global theme adjustments.