Research breakthroughs deserve visuals that match their gravity - enter the Advancing Medical Research Keynote Template, a beacon for scientists sharing trial outcomes or lecture halls unpacking genomic frontiers. Tailored for doctors, pharma leads, and academics, it offers 28 diagrams honed for data integrity, from cohort flows to efficacy curves. Keynote-optimized for Mac, with three masters for logical progression and seven schemes blending clinical neutrals with insightful accents. Effortlessly overlay p-values on forest plots or animate trial phases to trace endpoints, drawing from real protocols like those in NEJM studies. A clinical investigator streamlined a grant pitch using the progression timeline, mapping recruitment to analysis - securing funding that accelerated trials. This template elevates evidence over embellishment, ensuring your findings resonate. For $22, download it now and advance narratives that matter.
Precision Features for Rigorous Presentations
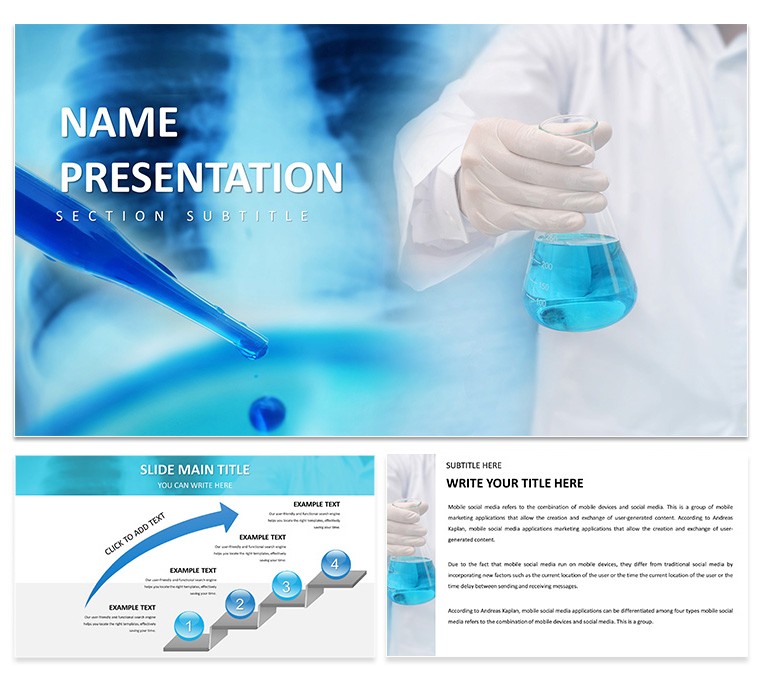
Three backgrounds evoke lab sterility or conference poise, framing 28 diagrams like survival Kaplan-Meiers or dose-response sigmoids. Editable via Keynote's vectors, adjust confidence intervals or embed PubMed links in footnotes.
Schemes prioritize readability - grays for controls, highlights for interventions - scaling flawlessly for posters or streams.
- Data-Driven Designs: Linked placeholders for stats software imports.
- Ethical Layouts: Anonymized patient icons for compliance.
- Dynamic Builds: Phased reveals for hypothesis testing sequences.
These empower focus on science, not styling.
Impactful Uses in Research Realms
Symposiums demand clarity; a postdoc's findings slide used meta-analysis bubbles, sizing by study weight - peers cited it in follow-ups. For trials, the enrollment funnel tracks dropouts, visualizing retention strategies.
Conference Keynotes and Reports
Structure reports with the outcomes matrix. Step one: Grid endpoints across arms. Step two: Color-code significances. Step three: Animate trends for subgroup insights. This framed a pharma update on biologics, sparking collaborations.
- Pull data from R outputs for accurate plots.
- Use masks for overlaying error bars.
- Archive versions via iCloud for IRB reviews.
Lectures and NGO Showcases
In classrooms, mechanism cascades illustrate pathways, building step-by-step. An NGO lead adapted for funding decks, flowcharting impact metrics - donors pledged more after the visual appeal.
It bridges lab to lay, advancing discourse.
Customization for Scientific Fidelity
Tune masters for journal-style headers. Group elements for batch stats updates. Test on retina displays for print-ready exports.
Surpassing basics, its protocol-aligned diagrams, like CONSORT flows, ensure methodological trust.
The Research Edge You Need
Aligned with dissemination standards, it amplifies credibility, turning data into dialogues that propel fields forward.
Download the Advancing Medical Research Keynote Template for $22 - illuminate your next discovery.
Frequently Asked Questions
Supports which data visualization tools?
Imports from GraphPad, SPSS; editable in Keynote for refinements.
Editable for custom trials?
Yes, all diagrams adapt to your protocols and endpoints.
Color schemes for color-blind users?
Includes accessible palettes; test with simulator tools.
File options for collaboration?
.key for teams; export to PDF for archives.
Includes statistical icons?
Vector set for p-values, CIs, and effect sizes.
Suitable for undergrad teaching?
Absolutely - simplify complex diagrams for foundational lessons.