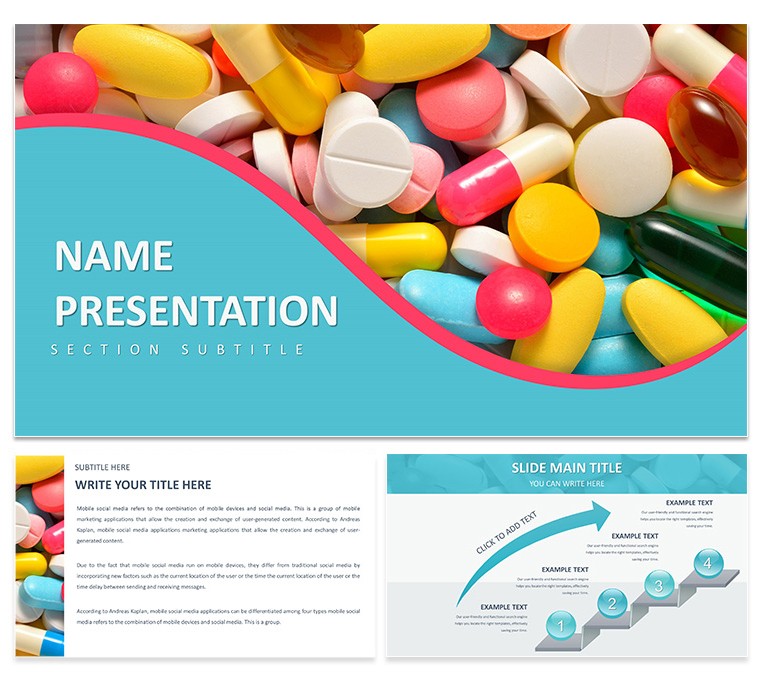
In the high-stakes world of pharmaceuticals, where a single slide can sway investors or regulators, clarity isn't optional - it's oxygen. The Pharmaceutical Industry Keynote Template delivers just that: a refined arsenal of 28 diagrams laser-focused on drug lifecycles, from lab bench to market launch. Built for R&D leads charting trial phases or marketers pitching blockbusters, it distills complexity into compelling visuals, letting data do the talking while you steer the strategy.
Three masters and backgrounds form the backbone, with seven color schemes evoking lab sterility or market vibrancy - think crisp whites for protocols, blues for pipelines. Keynote's prowess elevates it: dissolve transitions unveiling trial cohorts, or smart builds layering efficacy stats. This isn't generic pharma filler; it's a sector-specific scaffold, editable to weave in your proprietary insights, like folding in recent FDA nods without redesigning from scratch.
Envision a CRO director briefing on bioavailability curves (diagram 9), curves animating to show absorption peaks, stakeholders grasping nuances at first glance. Or a sales team arming reps with mechanism-of-action maps (page 16), icons pulsing to mimic molecular interactions. Free from fluff, it's for those navigating the industry's tightropes - researchers proving hypotheses, execs justifying budgets - all while keeping decks compliant and captivating.
Key Components for Pharma-Grade Presentations
The 28 diagrams are the template's pulse, segmented for relevance:
- Development Dynamics: Gantt charts for timelines, flow diagrams tracing synthesis steps.
- Trial Trajectories: Funnel visuals for enrollment, survival curves for endpoints.
- Market Maneuvers: SWOT matrices in pill-form icons, competitive landscapes as molecular orbits.
- Compliance Corners: Checklist timelines for submissions, risk pyramids for audits.
Masters split into executive summaries, data dens, and regulatory recaps, backgrounds neutral to spotlight charts without distraction. Tailor effortlessly: Keynote's format inspector lets you recalibrate axes on graphs or recolor molecules via drag-and-drop. Schemes range from monochromatic for reports to accented for pitches, ensuring adaptability across C-suite screens or conference projectors.
Navigating Your Pharma Deck Build
- Scope the Science: Align objectives - trial update? Launch strategy? - pulling pertinent diagrams like Phase III barometers.
- Embed Evidence: Paste assay data into placeholders; scale vectors to fit cohort sizes precisely.
- Harmonize Hues: Select a scheme, preview in lightbox mode for venue viability.
- Activate Analytics: Script builds for sequential data reveals, syncing with your explanatory beats.
- Validate and Vector: Cross-check for accuracy, export SVGs for whitepapers if extending reach.
Such rigor trumps blank-canvas chaos, where pharma precision demands but design diverts; this channels focus to facts.
Industry Applications: From Pipeline to Payoff
R&D teams thrive on process maps (page 4), threading discovery to preclinical, fostering cross-lab alignment. Product launches leverage efficacy radars (diagram 22), spokes radiating benefits to counter skeptics. Investor meets deploy ROI projections (page 28), geometric progressions forecasting revenues with unerring lines.
Regulatory filings benefit from milestone markers (page 13), bullet timelines ticking off IND to NDA, easing reviewer navigation. Training modules for field reps use interaction schemas (diagram 18), branching paths simulating patient queries. Drawn from sector stalwarts like those streamlining annual reports, these uses underscore the template's role in demystifying the drug odyssey.
Strategic Tweaks for Sector Success
Overlay confidential watermarks on sensitive slides for IP protection. Hyperlink appendices for deep-dive docs, streamlining Q&A flows. Optimize for hybrid events by baking in presenter notes with rebuttal points. Versus off-the-shelf pharma packs, its bespoke icons - like vial silhouettes for dosing - resonate with insider eyes, cutting through jargon jungles.
It mirrors pipeline logics: iterative, evidence-led, outcome-oriented. For strategists echoing data-driven mantras, it structures submissions with surgical intent.
Empowering Pharma's Visual Vanguard
Researchers rigorize reviews; marketers magnetize messages; regulators ratify readiness - all fortified by this focused framework. It's pharma's quiet enabler, turning terabytes into triumphs.
Secure the Pharmaceutical Industry Keynote Template for $22 now and prescribe precision to your presentations.
Frequently Asked Questions
What pharma processes are visualized?
Diagrams cover drug development, clinical trials, market analysis, research protocols, and regulatory pathways.
Compatibility with Keynote versions?
Fully supports Keynote 2016+, with vector elements preserving detail across updates.
Customization for branding?
Yes, recolor schemes and swap icons to align with corporate guidelines seamlessly.
Suitable for sales training?
Ideal - interaction and mechanism slides equip reps with persuasive, easy-to-grasp tools.
Export options available?
Export to PDF, video, or images, maintaining pharma-quality resolution for reports or shares.
Number of color schemes?
Seven options cater to formal reports or dynamic pitches.