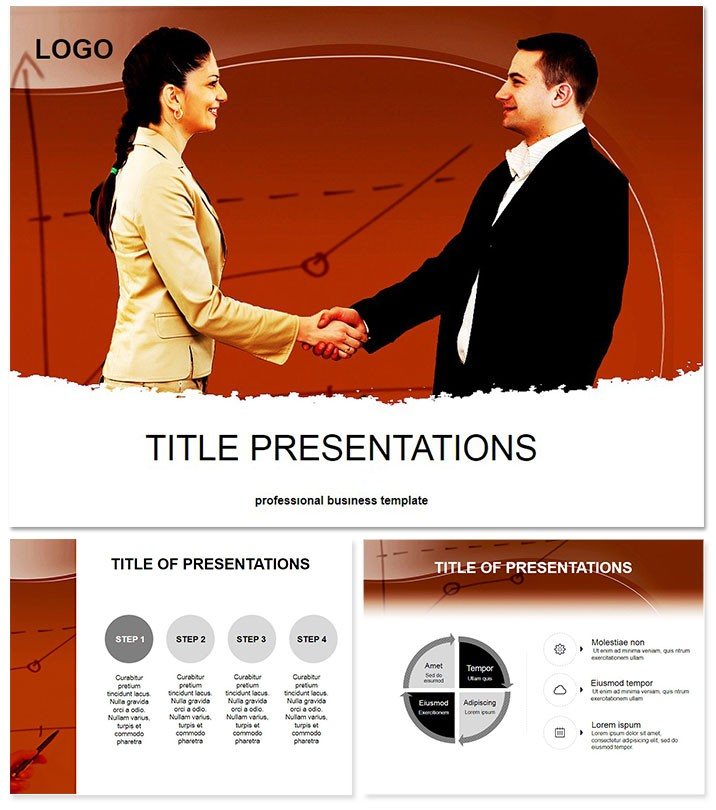
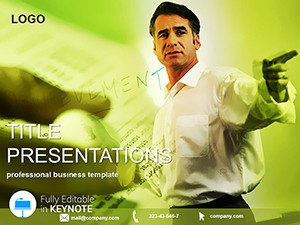
Struggling to make quantum mechanics or biotech breakthroughs pop on screen? This Applied Science Keynote Template bridges the gap between dense data and dazzling delivery. Tailored for scientists, engineers, and educators, it equips you with tools to visualize hypotheses, experiments, and findings effortlessly. Compatible with Keynote 2016 and beyond, it`s your all-in-one solution for presentations that inform and inspire. Secure lifetime access with a simple one-time buy, and edit freely across devices.
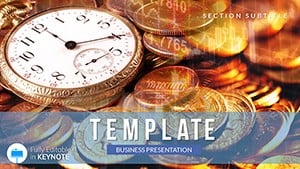
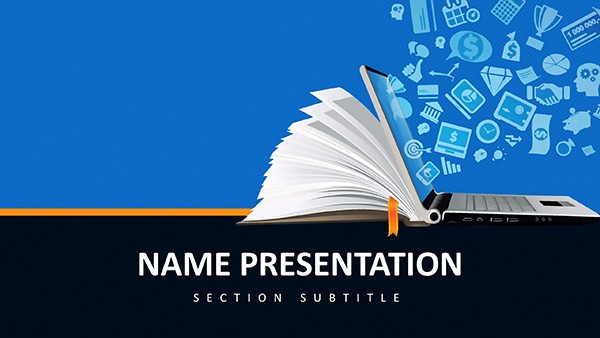
At its heart, this template demystifies science communication. With 28 specialized diagrams in 7 color schemes - from sterile lab whites to earthy greens symbolizing sustainability - you can adapt to any field. Swap variables in formulas, embed real lab photos, or animate molecular structures. It`s intuitive, letting novices shine like seasoned presenters while pros save precious research time.
Core Features at a Glance
Designed with precision, it includes three master slides for thematic consistency: one for data-heavy sections, another for narrative flows, and a third for interactive Q&A. Three backgrounds range from grid-patterned for equations to fluid waves for fluid dynamics demos.
- Seamless Customization: Edit placeholders for equations, resize graphs for statistical significance, and theme icons to lab equipment - all vector-based for crisp scaling.
- Advanced Visuals: Built-in charts like scatter plots for correlations, heatmaps for variable impacts, and 3D models for atomic simulations.
- Cross-Device Sync: iCloud integration means edits on desktop flow to iPad for on-the-go tweaks during conferences.
- Export Versatility: Generate high-res PDFs for journals or animated GIFs for social outreach, maintaining scientific accuracy.
It outperforms basic Keynote by embedding STEM-specific elements, like auto-formatting for chemical notations, ensuring your deck aligns with peer-reviewed standards.
Navigating the 28 Slides
Slide 1: Eye-catching title with a helix swirl placeholder, ideal for "Renewable Energy Innovations." Slides 2-4: Agenda and methods overviews - step-by-step infographics for experimental protocols.
Core research slides 5-12: Line graphs for longitudinal studies, bar charts comparing control vs. treatment groups, and Venn diagrams for interdisciplinary overlaps. Data analysis shines in 13-18: Regression models visualized as curves, box plots for outlier detection, and radial charts for multi-factor experiments.
Results and implications cover 19-25: Funnel diagrams for process efficiencies, bubble charts scaling impact by variables, and timelines for project milestones. Conclude with 26-28: Executive summaries, future outlooks via roadmaps, and contact slides with QR codes for datasets.
Animations add depth: phased reveals for hypothesis builds, zooms on key data points - transforming static slides into interactive explorations.
Practical Applications in Science
Researchers pitching grants can leverage timeline slides to map funding trajectories, inserting budget pies for resource allocation. Educators in engineering courses? Use scatter plots to illustrate force vectors, customizing axes for real-world physics problems.
A biotech startup founder recounted: "Turned our cell culture data into a compelling investor deck - the heatmaps made variability crystal clear, sealing the deal." For conferences, adapt for poster sessions by exporting modular sections.
In corporate R&D, it`s gold for quarterly updates: flowchart safety protocols or pyramid hierarchies for team structures, fostering clearer collaborations.
Superior to Standard Keynote Tools
Default themes lack scientific rigor; this one pre-loads notation tools and metric converters, slashing prep from days to hours. Its color schemes adhere to accessibility standards, unlike generic palettes that clash with data readability.
Ready to amplify your discoveries? Grab this template and let your science speak volumes.
Frequently Asked Questions
Does it support mathematical equations?Yes, with native LaTeX-like rendering for seamless formula integration.
Is it suitable for team collaborations?Perfectly - real-time co-editing via Keynote`s sharing features.
How many color options are there?Seven schemes, each optimized for print and screen contrast.
Can I add videos of experiments?Absolutely, with embedded placeholders that loop smoothly.
What`s the learning curve?Minimal - tutorials in the package guide first-time users.
License for academic use?Lifetime, covering lectures, papers, and grants.