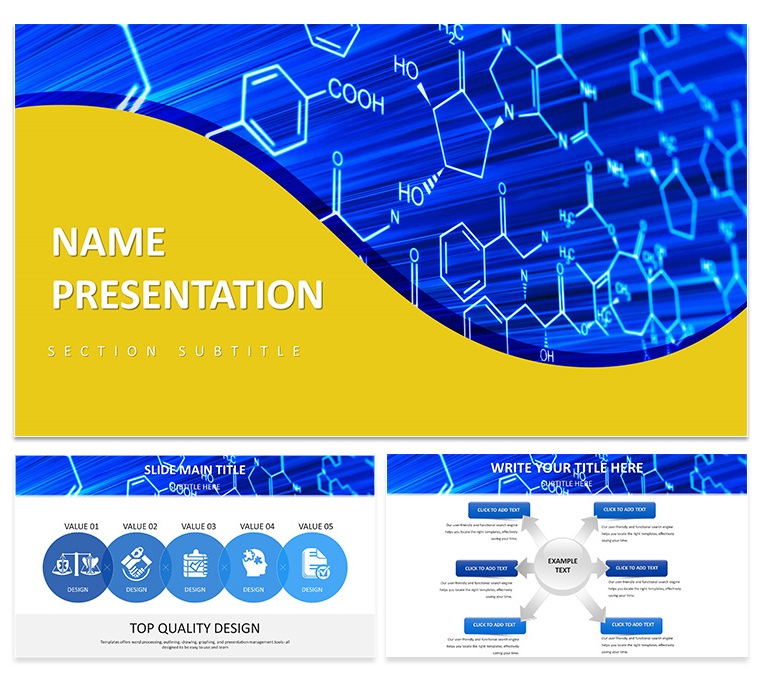
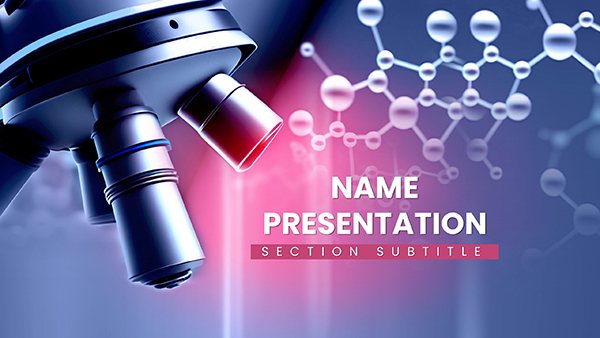
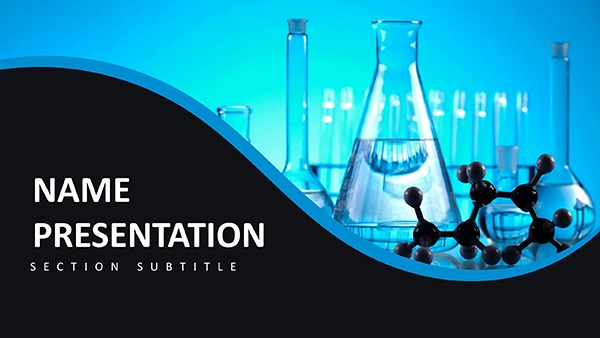
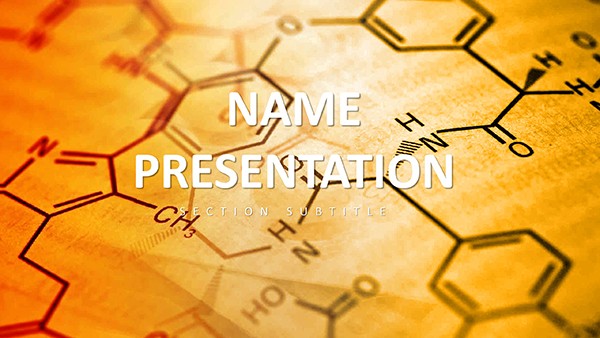
Envision unveiling a eureka moment where data dances into discovery, not drudgery. The Scientific Breakthrough Keynote Template ignites that spark for researchers, educators, and innovators eager to demystify the complex. Futuristic blues and silvers frame motifs of lightbulbs and lab flasks, turning hypotheses into hypnotic flows. Packed with 28 precision diagrams, three robust masters, and three immersive backgrounds, it dissects experiments, charts hypotheses, or rallies for grants - all in Keynote's collaborative haven.
Precision is paramount here: vector graphs that withstand scrutiny, icons evoking particle accelerators, and layouts that layer evidence logically. Whether simulating climate models or decoding neural pathways, edit fluidly - paste lab results into heatmaps, sequence reactions in cycles, or hyperlink sources for peer review. Mac-native, it syncs across devices for lab-to-lecture transitions.
Precision Tools for Scientific Storytelling
Calibrated for inquiry, these assets echo CERN's clarity in public outreach, where visuals bridged theory to triumph.
- 28 Research-Grade Diagrams: Heatmaps for spectral analysis or Sankey flows for energy transfers - each with equation placeholders for authenticity.
- Three Masters for Methodical Builds: Abstract titles with formula overlays, methodology slides with sequential grids, conclusion frames spotlighting implications.
- Seven Thematic Color Schemes: Lab whites for purity, plasma purples for innovation - calibrated for data distinction.
- Specialized Icon Set: 40+ elements like beakers and binaries, infinitely resizable for poster or pixel-perfect slides.
- Subtle Effect Layers: Glows on key findings or phased reveals mimicking experimental unfolds.
A biologist adapted its network diagram for ecosystem modeling, clarifying interconnections that won journal nods.
Lab-Tested Applications: Breakthroughs in Presentation
From journals to juries, this template catalyzes. Follow these protocols for peak performance.
Sharing Experimental Results
In lab meetings, launch with the hypothesis helix (Slide 7): spiral your question through variables, annotating with test icons. Deploy box plots (Slide 15) for outlier detection, whiskering stats from your dataset. Trace causality in cause-effect chains (Slide 22), arrowing inputs to outputs with conditional colors. Conclude with error bar emphases, quantifying confidence - mirroring Nature paper supplements for rigor.
Educating on Emerging Concepts
For classrooms, the concept cluster (Slide 3) webs theories: central node for quantum basics, radiating subtopics with link lines. Animate molecular models (Slide 18) to rotate bonds, syncing with explanatory builds. Summarize paradigms in timeline tiers (Slide 25), tiering eras from classical to contemporary. This fosters aha's, much like Khan Academy's visual evolutions.
Securing Funding Pitches
To panels, the impact infographic (Slide 12) quantifies potential: scale societal ripples from discovery outward. Budget breakdowns via stacked areas (Slide 24), layering costs with milestone ties. Forecast trajectories in exponential curves (Slide 28), projecting breakthroughs with fitted lines. It propelled a green energy proposal, blending science with societal sell.
Repurpose for posters or policy briefs - its scalability sustains science's spread.
Refinement Protocols for Keynote Labs
Amp up accuracy with these techniques:
- Formula Integration: Embed LaTeX snippets in text boxes for rendered equations, updating via copy-paste.
- Peer-Proof Alignment: Snap to 1mm grids for publication-grade precision in diagram spacing.
- Source Linking: Anchor citations to footnotes, expanding on click for transparent trails.
- Simulation Snippets: Time animations to match demo durations, rehearsing for fluid fusion.
These ensure decks dissect doubts, advancing discourse.
Outshining Stock Scientific Sketches
Defaults dilute details; this amplifies with domain-tuned diagrams and seven schemes for publication palettes. Streamlined for exports to PDF or SVG, it bridges presentation to print seamlessly.
Poised for your next revelation? Acquire the Scientific Breakthrough Keynote Template for $22 and catalyze conversations.
Frequently Asked Questions
Are diagrams suitable for technical data?
Yes - vector precision supports complex inputs like equations and high-res images without distortion.
Compatibility with collaboration tools?
Flawless with iCloud sharing, enabling real-time co-edits for team research.
Icon library size and style?
Over 40 scientific motifs in clean, modern line art for versatile application.
Adaptable for humanities talks?
Core layouts yes, though science icons shine brightest in empirical contexts.
Animation options for demos?
Extensive - sequence reveals, paths, and scales to mirror experimental dynamics.
Package contents overview?
Includes .key, .kth, .jpg previews, and setup notes for swift starts.