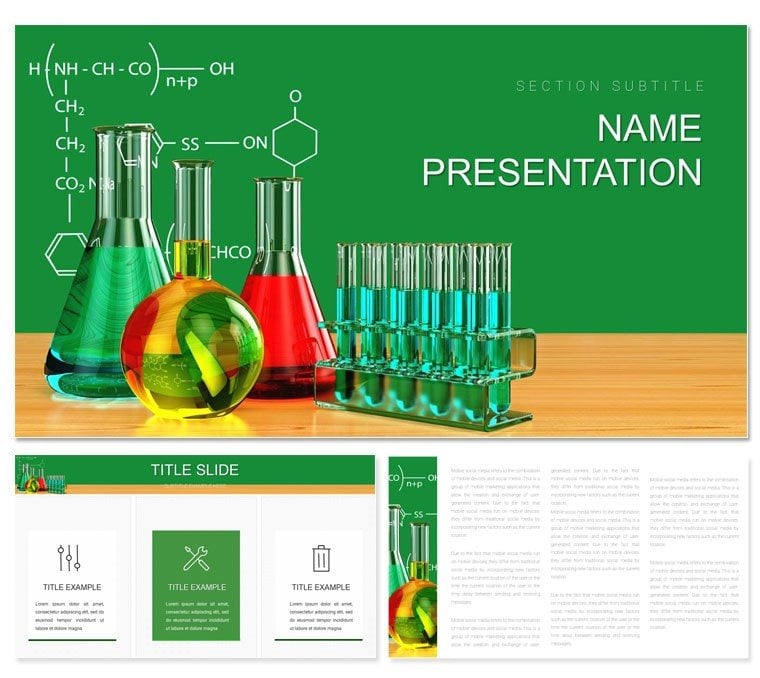
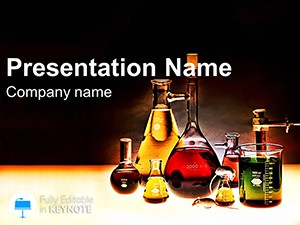
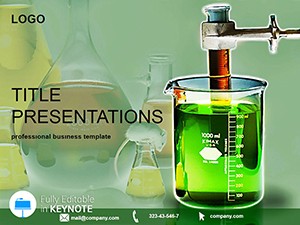
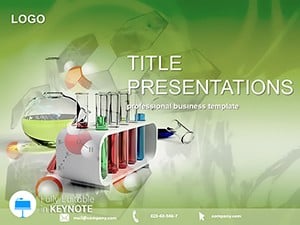
In the lab or lecture hall, where molecules matter and data drives discovery, your presentations need to match that rigor. Enter the Analytical Chemistry Keynote template - a sleek toolkit designed for chemists, researchers, educators, and even curious students diving into experiments. With its clean lines and sharp contrasts, it turns complex concepts like spectroscopy results or reaction kinetics into digestible visuals that spark understanding. Boasting 28 specialized diagrams, three adaptable masters, and three crisp backgrounds, this template is your ally in conveying the nuances of analytical work.
Why does it resonate? Chemistry isn't just numbers; it's stories of transformation. This template lets you layer in spectral graphs or titration curves without the hassle of from-scratch builds. Tailored for Apple Keynote, it's optimized for Mac's fluid interface, ensuring smooth drags and drops. Seven color schemes range from metallic silvers for lab sterility to vibrant blues for solution dynamics, helping you align with periodic table palettes or institutional branding. And at $22, it's an investment in clarity that pays off in engaged audiences.
Envision a grad student presenting thesis findings: Overlaying chromatograms on a process flow diagram, the audience follows the separation journey effortlessly. Or a pharma analyst briefing on quality controls, using pie charts to dissect impurity profiles. These slides don't just show data - they invite questions and collaborations. If you're ready to make your chemistry shine, download this template today and let precision propel your pitch.
Essential Features That Fuel Your Chemistry Narratives
At the core, the 28 diagrams are the heavy lifters. Think bar graphs for comparing reagent purities, scatter plots for calibration curves, or flowcharts mapping analytical workflows from sample prep to readout. Each is vector-based, so zoom in on molecular structures without blur, and edit paths to fit unique data sets.
The three masters streamline your setup: One for data-heavy slides with grid placeholders, another for text-led overviews, and a third for image-focused insights like microscope captures. Backgrounds vary from minimalist whites for focus to subtle gradients evoking lab glassware. Customizing colors? Select a scheme, and it cascades across - icons shift hues, charts recalibrate, all in seconds.
- Infographic-Ready Elements: Pre-built icons for beakers, pipettes, and bonds, resizable for emphasis.
- Hyperlink Support: Embed links to datasets or sims, turning static slides into interactive explorations.
- Export Versatility: PDF or video out for sharing beyond Keynote.
A neat trick: Use Keynote's magic move to transition between reaction stages, animating molecular changes seamlessly. It's these features that make abstract analytics feel alive.
Applying It Across Chemistry Contexts
From classroom demos to boardroom briefings, this template adapts. In research settings, build a slide deck around method validation: Start with a timeline diagram for protocol evolution, then pivot to tables comparing accuracy metrics. Insert your raw spectra as layered images, annotated with callouts for peaks of interest.
For educational use, simplify stoichiometry lessons with equation-balanced diagrams. A high school teacher might sequence slides from atomic models to yield calculations, using color-coded schemes to differentiate reactants and products. Kids grasp it faster when visuals mimic the lab bench.
Data-Driven Discoveries in Industry
Industry pros, like those in environmental testing, leverage it for compliance reports. Map pollutant detection pipelines with connected shapes, quantifying levels via line graphs. One analyst noted how swapping to a green scheme highlighted eco-impacts, swaying policy discussions.
Conceptual Clarity for Beginners
Even for introductory topics, like acid-base theories, the template demystifies. Use radial diagrams for pH scales, circling in on buffers. Students engage more, sketching their own versions post-presentation.
Workflow integration: Pull data from ChemDraw or Excel, paste into placeholders, and format on the fly. Duplicate masters for A/B testing slide variants, refining based on peer feedback.
Customization and Presentation Pro Tips
Launch Keynote, import the .key file, and apply themes via the inspector. Tweak fonts for readability - sans-serif like Helvetica for body, bold for formulas. For diagrams, select and edit: Change data points in tables, watch charts update live.
- Match Your Medium: Screen? Bold contrasts. Print? Softer tones.
- Incorporate Multimedia: Drag in QuickTime clips of titrations for dynamic demos.
- Rehearse with Notes: Keynote's outline view keeps your script synced.
Post-delivery, archive as a template for future decks. This isn't mere software - it's a catalyst for clearer communication in the world of analytical chemistry.
Elevate your next presentation with tools that match your expertise. Download for $22 and watch your slides react with brilliance.
Frequently Asked Questions
Is this template exclusive to analytical chemistry?
While optimized for it, the diagrams work for general science presentations too.
How editable are the color schemes?
Fully - adjust globally or per element for custom looks.
Does it include chemistry-specific icons?
Yes, from flasks to spectra, all vector-ready.
Compatible with iPad Keynote?
Perfectly, for on-the-go edits.
Can I add my own data visualizations?
Easily - import and overlay on existing bases.