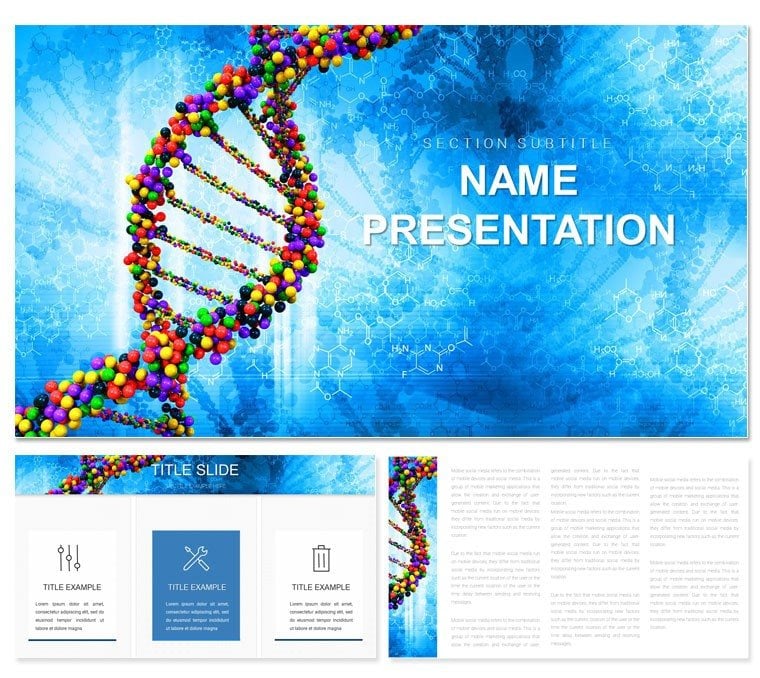
In the fast-paced world of genetic research, where every base pair counts, your slides need to match that precision. Enter the DNA and Genes Code Keynote template - a dedicated ally for lab professionals and university instructors aiming to decode intricate topics without losing their audience. This collection of 28 diagrams isn't mere decoration; it's a scaffold for building narratives around replication, mutation, and expression that stick. With three master layouts to guide your structure and seven color palettes to reflect lab rigor, it's built for those moments when you need to illustrate a polymerase chain reaction or a gene library scan with unflinching clarity.
Envision a chemistry lab team debriefing after a sequencing run: the flow diagram on slide 9 maps the entire pipeline, from extraction to analysis, letting you overlay real chromatograms effortlessly. Or in a university seminar, the hierarchical tree on slide 16 branches out evolutionary lineages, sparking debates that extend beyond the clock. The payoff? Deeper comprehension for viewers, from undergrads grappling with basics to peers probing advanced models. If you're tired of generic tools that dilute your expertise, this template restores focus to your discoveries. Dive in, and see how it adapts to your unique genetic tales.
Essential Features Tailored for Genetic Exploration
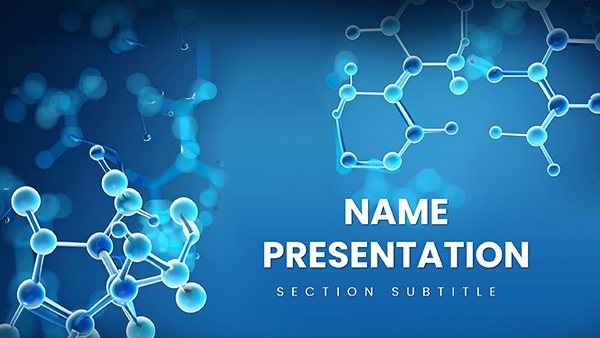
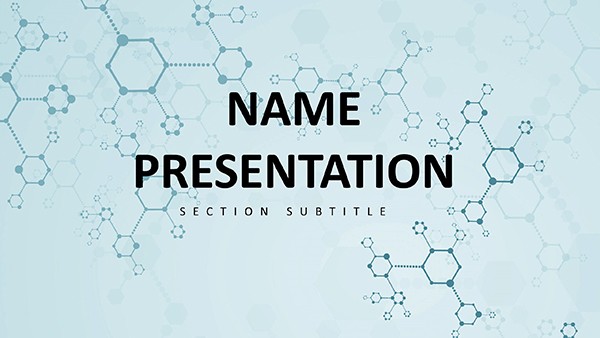
This template's backbone is its adaptability, starting with three masters that segment your deck logically: a launch pad for hypotheses, core canvases for evidence, and a wrap-up for implications. Three backgrounds complement them - clean whites for data purity, soft azures for molecular fluidity - ensuring your content breathes without distraction. The 28 diagrams cover the spectrum, from linear code sequences to circular plasmids, all vector-sharp and ready for your inputs.
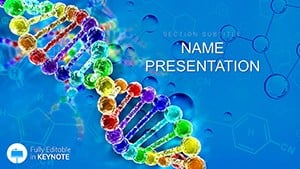
Seven color schemes add the finishing touch, with schemes evoking everything from neutral lab grays to vivid markers for error-prone sites. Delivered in .key and .kth, it slots into Keynote 2016+ workflows like a perfectly annealed primer. These aren't add-ons; they're the gears that make your presentation hum.
- Structured Masters: Three to organize from intro to outro seamlessly.
- Versatile Backgrounds: Three choices to suit formal labs or casual classes.
- Comprehensive Diagrams: 28 focused on DNA mechanics, from strands to systems.
- Palette Power: Seven options for thematic or institutional alignment.
Guided Customization: From Raw Code to Refined Deck
Launch Keynote, load the template, and you're off - select master one for your opener, infusing it with a custom gene snippet via the text fields. Progress to the sequencing ladder on slide 4: input your ladder bands, resizing rungs to fit data scales. For branching concepts like gene families, slide 11's tree diagram awaits; drag branches to reflect divergences, coloring clades for quick visual cues.
A savvy move: apply layer locks to protect base structures while editing overlays, preserving integrity during iterations. In group settings, the .kth export keeps styles uniform across contributors. Test animations on cycle diagrams to simulate transcription loops, drawing eyes through the action naturally.
- Load and outline: Map your talk to the masters for rhythm.
- Input essentials: Fill diagrams with lab outputs, like gel images.
- Harmonize hues: Cycle through schemes until it clicks.
- Incorporate extras: Slot in microscopy stills where placeholders beckon.
- Polish and present: Run through timings for flawless delivery.
This sequence turns potential chaos into a coded symphony, every slide a step forward.
Practical Scenarios: Genes in Action Across Settings
Consider a university chemistry lab wrapping a semester project: slide 20's matrix correlates gene expressions with environmental factors, plotting points from your assays to reveal patterns at a glance. Peers lean in, connections forming as dots align. Or in a corporate R&D review, the pathway infographic on slide 25 traces synthetic gene designs, using icons for enzymes to demystify bottlenecks.
For outreach, adapt the primer pair visual on slide 3 for public talks, simplifying jargon while retaining accuracy - attendees leave with a firmer grasp on everyday genetics. These applications mirror how lab leads and profs leverage such tools to bridge theory and practice, turning slides into springboards for collaboration.
Spotlight: Navigating the Diagram Collection
Slides 1-6: Foundations - code ribbons and base charts to ground your start.Slides 7-14: Dynamics - flows for replication and repair cycles.Slides 15-22: Analyses - trees and matrices for relational insights.Slides 23-28: Horizons - projections for gene tech futures.
Scalable vectors ensure they hold up under zoom, perfect for detailed annotations during Q&A.
Insider Strategies for Genetic Slide Mastery
Enhance with hyperlinks between related diagrams - click a mutation site to jump to its impact slide, guiding nonlinear explorations. For print backups, choose the high-contrast scheme to maintain legibility. Embed metadata in images, tagging "Agarose gel electrophoresis result" for easy searches later. Keep narratives concise: aim for visuals carrying 80% of the load, words the rest.
In multi-device prep, verify font renders across Macs; the sans-serif defaults hold steady. These habits, honed from Keynote's strengths, position your DNA decks as exemplars of clarity in a field awash with complexity.
With your genetic blueprint now in hand, craft decks that decode the future. Secure this template for $22 and let your genes tell their story vividly.
Frequently Asked Questions
What types of diagrams are in the DNA Genes Code template?
The 28 diagrams include sequences, flows, trees, and matrices tailored to genetic and lab themes.
Can I customize colors beyond the schemes?
Yes, each scheme serves as a base, but individual elements are fully adjustable for personal tweaks.
Does it work with older Keynote versions?
Optimized for 2016+, but check compatibility for earlier via Apple's guidelines.
How do I integrate lab data visuals?
Use built-in placeholders to drop in graphs or photos, with smart guides for alignment.
Is collaboration supported?
Export as .kth for theme sharing, enabling team edits without style drift.
What's the file size for smooth performance?
Compact design keeps it under 10MB, ensuring quick loads even with added media.