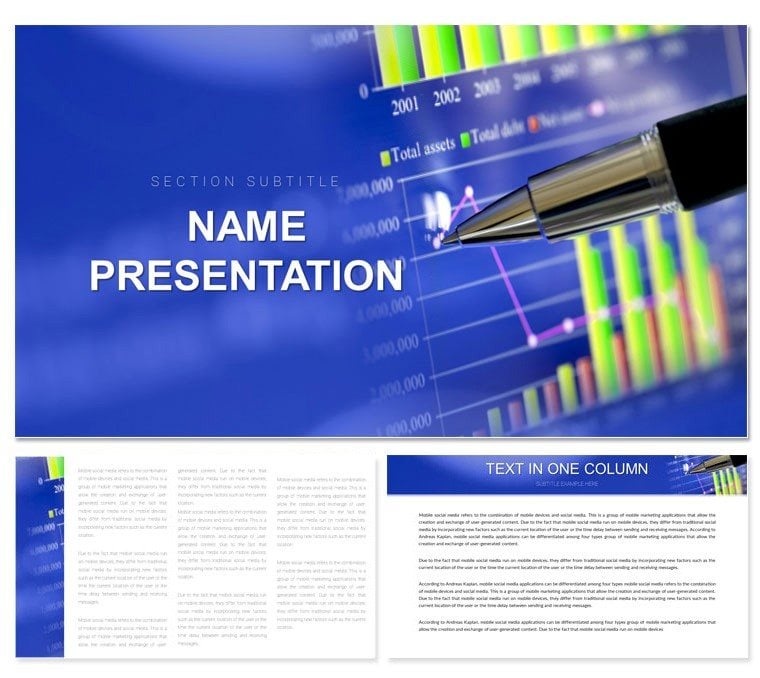
Imagine standing in a boardroom, your slides not just displaying numbers but weaving a narrative that shifts perspectives and sparks decisions. That's the power of the Business Analysis Keynote Template, crafted for professionals who turn raw data into strategic gold. Whether you're dissecting market trends for a consulting firm or outlining financial forecasts for your startup, this template equips you with 28 meticulously designed diagrams that blend precision with visual flair. With three master slides and backgrounds, plus seven versatile color schemes, it's your shortcut to presentations that resonate long after the meeting ends.
Designed for Keynote users on Mac, this template shines in scenarios where clarity meets impact - think quarterly reviews where executives need quick insights or investor pitches demanding undeniable evidence. You'll appreciate how each element, from interactive charts to sleek infographics, invites customization without a steep learning curve. Swap in your datasets, tweak fonts for brand alignment, or layer in animations to guide the eye. It's more than slides; it's a framework for confident communication that positions you as the go-to expert in your field.
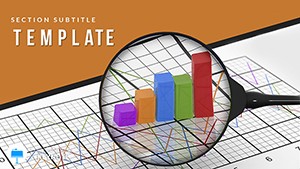
Core Features That Drive Results
At its heart, this template prioritizes flexibility and professionalism. Start with the three master layouts, each optimized for different flow: one for dense data dives, another for high-level overviews, and the third for narrative-driven sections. The backgrounds - subtle gradients and clean whites - ensure your content pops without distraction.
- 28 Tailored Diagrams: From SWOT matrices that highlight strengths at a glance to process flows mapping operational efficiencies, these aren't generic placeholders. Each diagram is vector-based, scaling perfectly for any screen size, and fully editable in Keynote's native tools.
- Seven Color Schemes: Choose from professional palettes like cool blues for trust-building analytics or warm earth tones for collaborative strategy sessions. Colors are harmonious, accessible for all viewers, and easy to adjust via Keynote's color picker.
- Seamless Integration: Import your Excel data directly into charts for real-time updates, or drag-and-drop images to personalize timelines. Everything works with Keynote's collaboration features, so remote teams can refine together effortlessly.
These elements combine to save you hours of design drudgery, letting you focus on the story behind the numbers. For instance, in a competitive analysis slide, layer competitor benchmarks over a radar chart to visually underscore your edge - simple yet profoundly persuasive.
Real-World Applications for Business Pros
Business analysis thrives on context, and this template adapts to yours. Picture a management consultant prepping for a client merger discussion: Use the funnel diagram to illustrate cost synergies, animating stages to reveal phased savings. Or, as a financial analyst, employ the Gantt-style timeline to project ROI timelines, color-coding risks for at-a-glance warnings.
Here's a step-by-step on leveraging it for a market entry strategy pitch:
- Outline the Landscape: Kick off with a PESTLE analysis wheel, populating each segment with bullet-point insights pulled from your research.
- Visualize Opportunities: Transition to a bubble chart where size represents market potential and position indicates competitive intensity - drag nodes to reflect updates.
- Map the Path: Build a roadmap infographic, linking milestones with curved arrows that Keynote animates smoothly.
- Close with Metrics: End on a KPI dashboard, using donut charts for goal attainment, ensuring metrics align with your narrative arc.
This structure not only holds attention but builds a logical progression, much like how firms like McKinsey layer insights in their decks. Adapt it for internal use too - sales teams tracking pipeline health or HR plotting talent retention trends.
Customization Tips for Maximum Impact
To make it yours, begin in Keynote's master view: Adjust typography to your brand's sans-serif for readability on projectors. For data-heavy slides, enable build effects so metrics reveal progressively, mimicking a consultant's reveal technique. Test on different devices - the responsive design ensures crisp lines whether on a laptop or conference room display.
Pro tip: Pair diagrams with subtle icons from Keynote's library to denote categories, like a gear for operations or a lightbulb for innovations. This adds a layer of intuitiveness, helping non-expert audiences grasp concepts faster.
Why This Template Outshines Basic Options
Compared to starting from scratch in Keynote, this template skips the blank-canvas paralysis. No more wrestling with alignment grids or recoloring mismatched elements - everything's pre-aligned and thematic. It's like having a design-savvy colleague who specializes in analytics visuals, delivering polish without the invoice.
For educators in business schools, it transforms dry case studies into interactive explorations, where students manipulate variables in real-time. Entrepreneurs pitching to VCs find the clean aesthetics convey competence, letting ideas take center stage.
Streamline Your Workflow with Keynote Best Practices
Integrate this into your routine: After downloading the .key and .kth files, duplicate the master for version control. Use Keynote's outline view to rearrange slides logically, then hyperlink navigation elements for non-linear jumps - ideal for Q&A detours.
Export options abound: Share as interactive PDFs for stakeholders or record narrations for async updates. With compatibility across recent Keynote versions, it's future-proof for your evolving toolkit.
Ready to transform how you present analysis? Download the Business Analysis Keynote Template for $22 and craft decks that don't just inform - they inspire action.
Frequently Asked Questions
Is this template fully editable in Keynote?
Yes, every element - from text and shapes to charts - is fully editable using Keynote's built-in tools, allowing complete customization to fit your needs.
What file formats are included?
You'll receive .key and .kth files, ensuring compatibility with Keynote on Mac and easy theme application.
Can I use this for non-business presentations?
Absolutely, the versatile diagrams work well for any data-driven talk, like academic reports or project updates.
How many color options are there?
Seven professional color schemes are provided, each optimized for diagrams to maintain visual consistency.
Does it support animations?
Keynote's native animation features are fully supported; apply builds and transitions to enhance flow without extra effort.
What's the best way to add my data?
Copy-paste from spreadsheets into charts, or use Keynote's data editor for precise control over values and labels.