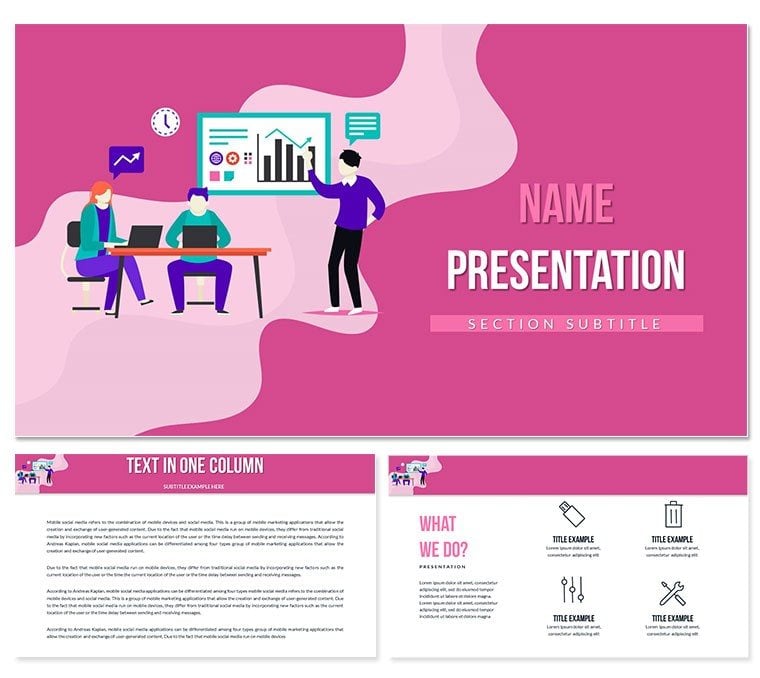
What is a Keynote diagram template for analytics and forecasting presentations? It is a pre-structured Apple Keynote file containing 28 editable diagrams organized around three distinct presentation modes: displaying expert opinion data, visualizing analytics, and communicating forward-looking forecasts - built for consultants and analysts who present data-heavy material to decision-making audiences.
28 Diagrams, 7 Color Schemes: What You Get
28 diagrams and 7 color schemes are in the paid tier ($22.00). The files ship as .key for direct editing in Keynote 12+ and .kth for applying the master theme to an existing deck. Three masters and three backgrounds are in both the base ($10.00) and paid versions; the diagram library is paid-only.
The 28 diagrams divide into three functional zones. The expert opinion layouts provide structured frameworks for displaying quoted data, survey results, and attributed analyst positions - visual structures that give cited material a visual hierarchy rather than a plain text list. The analytics diagrams include chart types suited for performance data: comparison bars, trend lines, segmentation breakdowns, and data matrix layouts. The forecast diagrams are forward-projection structures: growth curves, scenario comparison grids, and timeline projections with confidence interval indicators.
Consulting decks typically need all three modes in a single presentation: a client briefing that opens with market expert positions, moves through current-state analytics, and closes with projected scenarios. Unlike sets built around a single analytical frame - purely chart-based or purely narrative - this collection spans all three zones in one cohesive visual language, letting the presenter move between modes without visual discontinuity.
Editing Capabilities at a Glance
| Feature | Details |
|---|
| Diagrams included | 28 across expert opinion, analytics, and forecast diagram categories |
| Color schemes | 7 - applicable per diagram independently |
| File formats | .key (editable), .kth (theme for existing decks) |
| Masters and backgrounds | 3 masters, 3 backgrounds in both tiers |
| Base tier | 3 masters + 3 backgrounds, $10.00 |
| Paid tier | 28 diagrams + 7 color schemes, $22.00 |
| Text placeholders | Expert attribution fields, data labels, and forecast axis labels update independently |
| Keynote compatibility | Keynote 12 and later (macOS) |
How Consultants Use This in Client Work
A senior strategy consultant at a management consultancy prepares a quarterly market intelligence briefing for a retail sector client. The deck must open with analyst consensus positions, transition through current-state data on consumer spend patterns, and close with three market trajectory scenarios. Using the expert opinion frameworks and forecast scenario grids from this set, she assembled the full deck in 2 hours rather than the usual 4-5, and reused the same structural layout for the following quarter's briefing by replacing data figures and swapping the color scheme from the navy to a warmer amber variant to distinguish the new reporting period visually.
A financial analyst at a mid-size investment research firm uses the analytics chart diagrams for internal performance reviews. Comparison layouts that place three data series side by side - current period, prior period, and benchmark - required building from a blank chart template each cycle. The pre-built comparison bars in this set reduced slide production time per review deck from 90 minutes to under 30, freeing time for the analysis itself rather than the presentation mechanics.
A marketing research director at a consumer goods company uses the forecast diagrams in executive briefings. Scenario comparison grids - showing optimistic, base, and conservative projections in a single structured view - are more defensible to a skeptical executive audience than a single trend line. The structured forecast layouts gave the director's projections a visual credibility that unformatted chart exports from Excel lacked.
Download the Analytics Forecasts Keynote template and start editing immediately.
Edit, Brand, Present: The Workflow
How do I customize this analytics Keynote template for my brand? Open the .key file, replace data labels and attribution fields, adjust colors through the master, and export. Full steps below.
- Step 1 - Open the .key file in Keynote 12 or later (1 minute)
- Step 2 - Select diagrams by category - choose from expert opinion, analytics chart, or forecast layout types based on your deck structure (2 minutes)
- Step 3 - Apply a color scheme from the 7 available - navigate via the master slide panel; scheme applies to all elements simultaneously (2 minutes)
- Step 4 - Replace attribution fields, data labels, and axis values - all text placeholders are independent and do not require ungrouping shapes (6-10 minutes per section)
- Step 5 - Adjust forecast axis ranges if your projection timelines differ from the default scale (3 minutes)
- Step 6 - Export as .key for team collaboration or PDF for client distribution (1 minute)
Editing difficulty: Beginner to Moderate. Expert opinion and analytics diagrams are beginner-level edits - text replacement and color switching. Forecast diagrams with axis scale adjustments require basic Keynote chart familiarity.
What You'd Need to Replicate This Yourself
Building 28 diagrams across three structural categories - expert opinion frameworks, analytics charts, and forecast projection layouts - in Keynote from a blank file requires sourcing or designing attribution display structures (not a native Keynote template type), configuring multi-series comparison charts, and constructing scenario comparison grids. Skilled Keynote users typically spend 8-14 hours on a comparable set. The scenario grid and confidence interval structures are particularly time-intensive: Keynote's native chart tools do not produce them directly.
A design observation relevant to consulting presentations: forecast diagrams that place confidence intervals visually - using shaded ranges around a central trend line rather than error bars - communicate projection uncertainty more intuitively to non-technical executive audiences. Executives comfortable with financial ranges read shaded projection bands immediately; they do not always read statistical error bar conventions correctly. The forecast layouts in this set use shaded range indicators rather than raw error bars - a deliberate choice for the consulting and senior management audience this template targets.
- Native scenario comparison grid support in Keynote: none - requires manual construction
- Time to build expert opinion + analytics + forecast diagram set from scratch: 8-14 hours
- Time to adapt this template to a full consulting deck: 2-3 hours
- Visual language consistency across all 3 diagram types: built-in; requires no alignment work
Consulting presentations assembled from mixed sources - one diagram from a generic chart tool, another from a manual Keynote build - produce visual inconsistencies in line weight, font size, and color usage that experienced client audiences notice. A unified diagram set eliminates that inconsistency at the source.
Download the Analytics Forecasts Keynote template and start editing immediately.
Frequently Asked Questions
Which Keynote version is required?
Keynote 12 or later is required for full functionality, including color scheme switching and master slide editing. Keynote 12 runs on macOS Monterey and newer. The .kth file is importable as a theme in older Keynote versions via Change Theme, but the 7 diagram color variants and master editing features require Keynote 12+. Check your Keynote version in the App Store before purchasing if you are on an older macOS - updates are free but require OS compatibility. Keynote on iPad opens .key files, though editing multi-layer analytics diagrams is more practical on macOS.
What is the difference between the $10.00 base and the $22.00 paid version?
The base version ($10.00) provides the 3 master slide layouts and 3 backgrounds - a branded structural frame without diagram content. The paid version ($22.00) adds all 28 analytics, expert opinion, and forecast diagrams plus 7 color schemes. For consultants and analysts who need structured visual layouts for data and projections, the paid tier is the only complete version. The base tier alone does not contain any analytics chart, expert opinion framework, or forecast structure - it is a blank master only.
Can I use this template in client-facing consulting deliverables?
Yes. The standard license permits use in client presentations, market intelligence reports, and internal executive briefings. Consultants can customize diagrams and present them as part of paid client deliverables. Resale of the template files as a standalone product or redistribution through other channels is not permitted. For use that goes beyond standard presentation - such as embedding diagram layouts in published research reports distributed outside client relationships - review the full Terms of Use on ImagineLayout.com before proceeding.
How do I adjust the forecast axis scales for my data?
Open the .key file in Keynote 12+, select the forecast diagram slide, and double-click on the chart element to enter editing mode. In chart editing mode, the axis range fields appear in the Format sidebar - replace the default min, max, and interval values with your actual projection scale. Text labels on axis markers are independent text boxes; click each to update the value. For scenario comparison grids that use shape-based rather than native chart elements, text fields are updated directly by clicking into each placeholder. No ungrouping is required for standard forecast layout edits.
Does the template support animations for phased data reveals?
No animations are pre-applied in the template. All diagrams are static on delivery. In Keynote, adding build-in animations is straightforward: select a chart element, data segment, or diagram shape, open the Animate panel, and choose an effect. For analytics comparisons, applying a sequential Appear or Wipe effect to each data series creates a phased reveal that guides the audience through the data in order. For forecast diagrams with multiple scenario lines, a staged Move In effect on each scenario curve is effective. All animations are reversible - delete them from the Animate panel without affecting the underlying diagram.
What is the refund policy?
ImagineLayout maintains a refund policy for template purchases. The full terms and submission process are available on the Refund Policy page at ImagineLayout.com. Eligibility is assessed based on whether the delivered files match the product description. To initiate a refund request, contact ImagineLayout support through the Contact page with your order number. Keep downloaded files available until a decision is communicated from the support team.
Consulting teams who work across analytics and marketing often explore the Consulting Keynote theme collection for complementary diagram sets. For presentations focused on digital marketing analytics specifically, the analytics Keynote diagram template provides a focused alternative. Teams that combine forecast decks with process-based marketing diagrams also review the marketing processes Keynote template for structural pairing.