Growth Chart Business Card Template: Map Your Path to Professional Peaks
Type: Business Cards template
Category: Finance - Accounting
Sources Available: .ait, .dotx, .indt, .jpg
Page size: 2x3,5
Product ID: BC00839
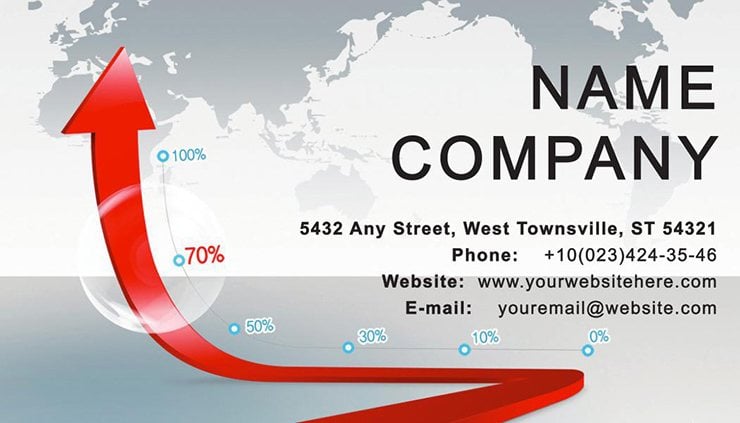
Envision a business card that doesn`t merely list details - it charts the trajectory of your ambitions, turning a pocket-sized exchange into a roadmap of potential partnerships. Our Growth Chart Business Card Template is engineered for ambitious minds in finance, marketing, technology, and beyond, offering print-ready, customizable designs that visualize success. At 2x3.5 inches, it`s compact yet commanding, ideal for entrepreneurs, freelancers, and executives aiming to leave a mark that lingers.
The genius lies in its data-inspired aesthetics: subtle line graphs and bar motifs integrated seamlessly, symbolizing upward momentum without clutter. Formats span .ait for intricate Illustrator work, .dotx for accessible Word edits, .indt for InDesign pros, and JPG for instant mocks - versatile for any workflow. Print on 100lb linen per ISO 12647 standards for a textured, professional heft that feels as substantial as your goals.
This template solves the entrepreneur`s dilemma: cards that underplay achievements. Instead, it quantifies impact visually, akin to infographics in Forbes features that drive engagement. A tech startup founder might use ascending lines to hint at scaling ventures; a marketer, pie charts for campaign wins - rooted in data visualization best practices from Edward Tufte`s canon.
Core Components: The Building Blocks of Your Brand Story
Explore the toolkit that turns static cards into dynamic narratives.
- Chart Elements: Editable vectors - lines, bars, icons - scalable to represent metrics like revenue growth or client acquisitions.
- Adaptive Backgrounds: Ten+ options from minimalist grids to textured waves, swapable for industry fit.
- Data-Friendly Layout: Zones for metrics alongside contacts, with space for a tagline like "Scaling Success."
- Output Optimization: Grayscale options for cost savings, full color for vibrancy; includes trim guides.
Harvard Business Review notes visual aids boost retention 65% - harness that for your networking edge.
Navigate Customization: From Concept to Card in a Flash
- Acquire and Unpack: Post-download, files await in thematic folders for quick selection.
- Tool of Choice: Dive into InDesign for layout mastery or Word for speed - both yield pro results.
- Chart Your Data: Input real figures via simple tables; auto-generate visuals with linked charts.
- Brand Alignment: Fonts like Roboto for clarity, logo at 20% opacity overlay for subtlety.
- Validate and Produce: JPG preview for feedback, PDF to printers like Staples for rapid turnaround.
Take Jordan, a fintech freelancer whose charted cards at a conference visualized ROI, securing two venture intros. His pro move? Dynamic QR to interactive dashboards - elevating from card to conversation.
Strategic Scenarios: Fueling Growth Across Sectors
Tailored for diversity: Finance pros graph portfolios; techies plot app metrics. Entrepreneurs chart milestones; corporates, team KPIs.
Superior to vanilla templates, it embeds storytelling - no filler florals, just purposeful plots. Digital PDFs suit hybrid events, extending utility.
Insight: Animate charts in video intros via After Effects exports, per AMA digital trends.
Maximize Momentum with Proven Tactics
- Share strategically: "This chart? Our last quarter`s wins - yours next?"
- Leverage NFC chips in premium prints for tap-to-connect.
- Recycled paper for sustainable narratives, aligning with ESG values.
It`s your portable pitch, graphing futures together.
Outpace Peers with Data-Driven Design
Inspired by Gartner visuals, it exemplifies expertise. User-centric, with scalability notes.
Plot your ascent - download the Growth Chart Template now and trajectory toward triumphs.
Frequently Asked Questions
Can charts incorporate real data?
Yes - link to Excel for live updates; vectors ensure crisp scaling.
What backgrounds suit finance?
Grid patterns mimic spreadsheets; swap for waves in creative fields.
Print costs for small runs?
Affordable at $20/100 via Vistaprint; bulk drops to pennies.
Digital optimization tips?
Flatten layers for email; retain transparency for web.
Industry-specific tweaks?
Color-code bars: greens for growth in eco-tech.
QR integration for metrics?
Link to dashboards; track scans with Bitly.