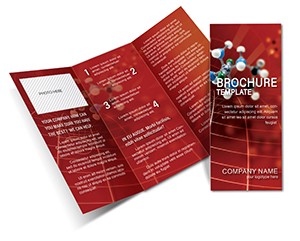
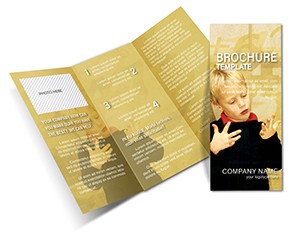
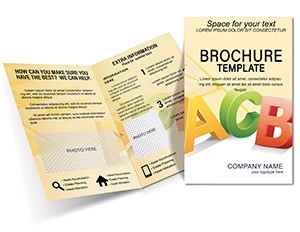
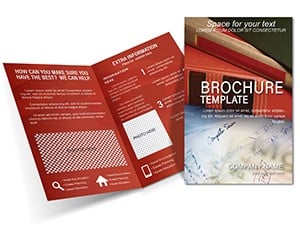
Infographic Knowledge Brochure Template
Type: Brochures template
Category: Education & Training
Sources Available: .ait, .dotx, .indt
Product ID: BT01389
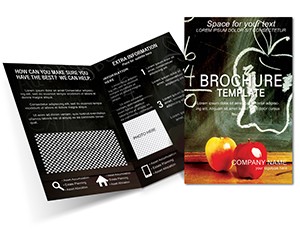
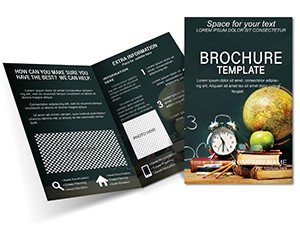
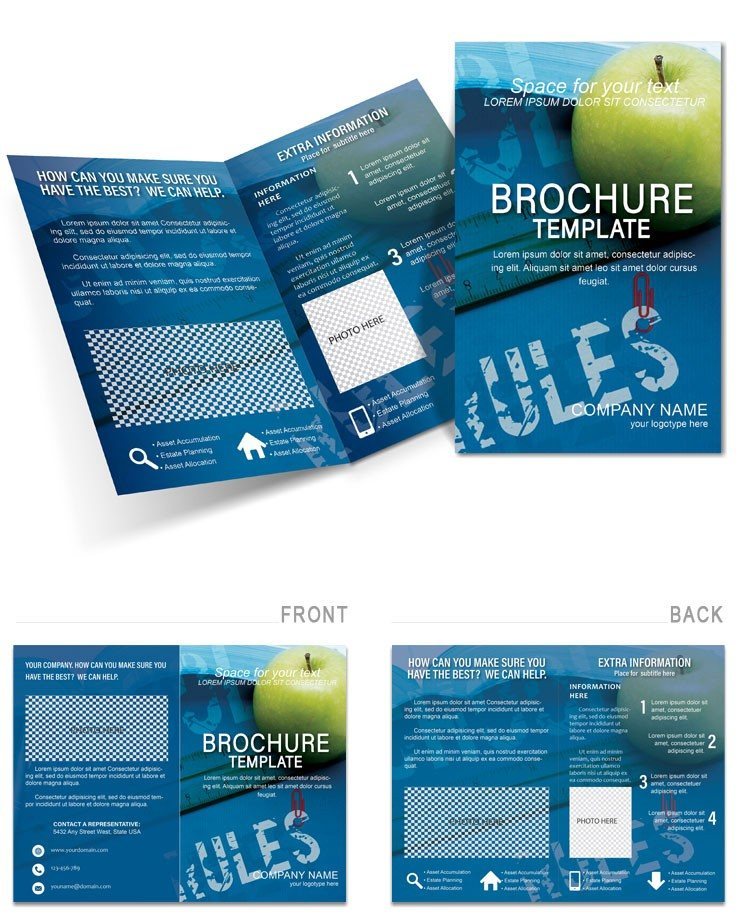
Ever struggled to package dense research into something digestible for a boardroom or classroom? Our Infographic Knowledge Brochure Template solves that, weaving data into visual stories via a sophisticated tri-fold that illuminates without intimidating. Suited for researchers, teachers, or consultants, it distills insights - from market trends to scientific findings - into flows that foster understanding and dialogue.
Embracing a sleek, info-first style with timelines, pie charts, and flow diagrams, it starts with a cover abstract (e.g., "Unlocking Urban Insights"), unfolds to layered explanations, and closes with key takeaways. It's a bridge from complexity to clarity, customizable to spotlight your expertise.
Infographic Power at Your Fingertips
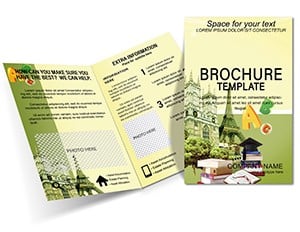
Central to its appeal is smart visualization. Panels host interconnected elements: a process map on one, stat callouts on another, narrative bridges tying them. Neutral bases - whites with accent pops - let data shine, scalable for various depths.
Versatile formats (.ait, .dotx, .indt) mean fluid workflows: Illustrator for charts, Word for notes, InDesign for polish. Print-optimized for reports, with options for digital flips.
- Visual Vault: Pre-built graphs, editable via simple data swaps.
- Flow Frameworks: Guided paths for logical progression.
- Scalable Symbols: Icons that resize without loss.
Jump in: Input datasets, align visuals, export - it's knowledge distilled, design-democratized.
Versatile Venues for Insight Sharing
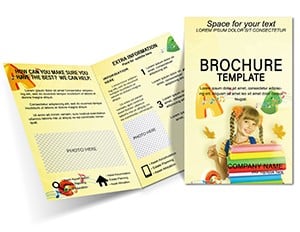
Maximize in diverse contexts. An academic preps conference handouts: customize with study visuals, citation footers, sparking post-talk Q&A. Attendees retain more, crediting your clarity.
Consultants craft client summaries - trend analyses front, implications mid, actions back. Or educators build unit overviews, embedding quizzes for engagement. These spark deeper dives.
- Chart Your Core: Prioritize data types to panel fits.
- Enrich with Evidence: Link to sources via footnotes.
- Validate Variety: Test on devices for cross-format flow.
- Invite Interaction: Add discussion prompts for groups.
Transcends slides by offering tangible, revisit-ready recaps.
Refine for Your Narrative Nuance
Tailor thoughtfully: Adjust chart types for sectors - bars for finance, lines for science. Layer InDesign for multi-view, Word for annotations. Integrate embeds like mind maps.
Case in point: A think tank visualized policy impacts, using flows to trace effects. It clarified debates, enhancing advocacy reach.
Boost with alt-text and color-blind modes for broad access.
Illuminate Minds, Effortlessly
This template turns info overload into enlightenment, positioning you as a beacon of brevity. Share wisdom that sticks.
Acquire the Infographic Knowledge Brochure Template for $22 - download and enlighten now.
Frequently Asked Questions
Can I import external data?
Yes, placeholders link to Excel for auto-updates.
Best format for charts?
Illustrator (.ait) for precise vector editing.
Is it digital-friendly?
Sure, PDF outputs support hyperlinks and zooms.
How to customize colors?
Swatch edits propagate across elements uniformly.
Suitable for long reports?
Extendable in InDesign for added pages.