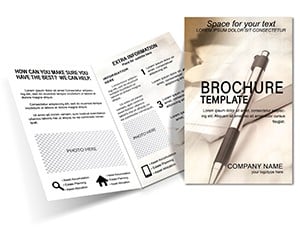
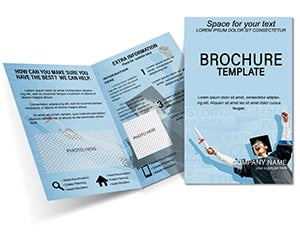
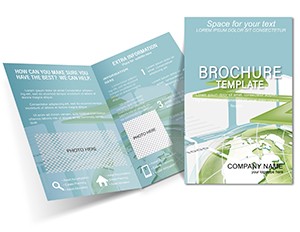
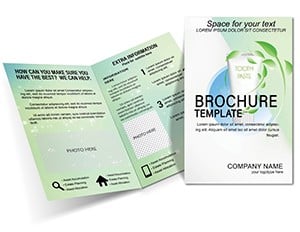
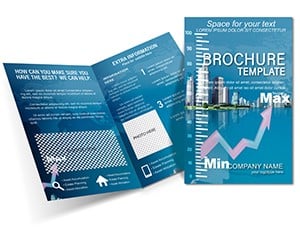
Exploring Graph Brochure Template
Type: Brochures template
Category: Finance - Accounting
Fold type: Half Fold
Sources Available: .ait, .dotx, .indt
Page size: 11x8.5
Product ID: BT01192
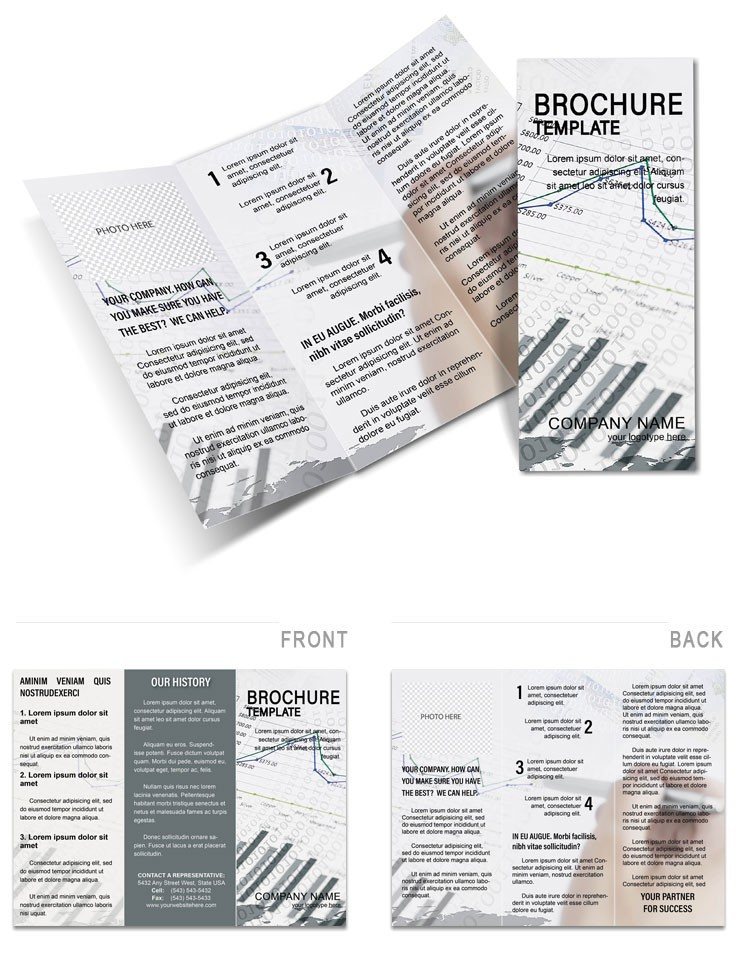
Envision a brochure that turns dense market data into digestible visuals, guiding readers through trends like a seasoned analyst's tour. Our Exploring Graph brochure template is crafted for finance teams, accountants, and market reviewers who need to communicate insights with clarity and confidence. This half-fold powerhouse demystifies trade fluctuations, revenue forecasts, and investment opportunities, making it a staple for quarterly reports or client briefings.
For $22, unlock .ait, .dotx, and .indt files optimized for 11x8.5-inch prints, complete with pre-built graphs that scale from bar charts to pie breakdowns. The neutral blue-gray scheme conveys professionalism, while grid lines and axis placeholders ensure accuracy. Ideal for stapling into folders for board meetings or folding for one-on-one pitches, it bridges numbers and narratives seamlessly.
Navigating Panels with Precision Data
Six panels structure your story logically: The cover introduces with a bold graph teaser and your firm logo, setting an authoritative tone. Inner left unpacks key metrics - editable tables for quarterly sales or risk assessments - while right features line graphs for trend projections, with data import spots for Excel pulls.
The back wraps with recommendations, including icon-supported action steps like "Diversify now" linked to contact forms. The central spread dives deeper, offering scatter plots for correlation analysis or flowcharts for process overviews. Its edge? Smart objects in Illustrator let graphs update dynamically when you edit source data, saving recalculations. In Word, simple drag-resizes keep layouts intact for non-designers.
Streamlined Steps to Data-Driven Design
- Prep Your Dataset: Compile figures in a spreadsheet - sales volumes, growth rates - ensuring they're formatted for easy copy-paste into graph tools.
- Access the Template: Fire up .indt in InDesign for layout finesse or .dotx in Word for quick starts; fonts like Calibri ensure corporate readability.
- Input and Visualize: Paste data into placeholders; watch bars auto-adjust heights, then label axes with specifics like "Q4 Revenue ($M)."
- Refine Insights: Add annotations, such as trend arrows or benchmark lines, to highlight "20% YoY uplift" without cluttering space.
- Validate Output: Print a draft on standard bond paper, fold, and scan for legibility - adjust fonts if small text blurs on curves.
This method condenses analysis time, letting you pivot from raw numbers to polished communications swiftly.
Strategic Uses in Finance and Trade
Accountants can deploy this for audit summaries, using panels to chart compliance metrics and forecast audits. Market analysts might tailor it for sector reports, with pie charts dissecting market shares for investor decks. Trade firms could focus on supply chain visuals, mapping disruptions via timelines for stakeholder updates.
Picture a finance advisor prepping a client review: They slot portfolio performance graphs into the spread, adding personalized notes on rebalancing - turning data dumps into tailored advice. Or a trading desk sharing daily briefs - the compact fold slips into envelopes, keeping teams informed without overwhelming inboxes.
Expert Hacks for Impactful Graphs
- Color-Code Wisely: Assign blues for positives, reds for risks in bar charts to subconsciously guide interpretations.
- Layer Interactivity: In digital PDFs, hyperlink graph segments to detailed spreadsheets for deeper dives.
- Avoid Overload: Limit to 3-4 data series per visual; use the side panel for footnotes on methodologies.
These techniques amplify understanding, making your brochure a trusted ally in decision-making.
Superior Tools for Analytical Minds
Standing tall against plain spreadsheets, this template's embedded formulas in InDesign calculate percentages on-the-fly, reducing errors. The half-fold promotes a logical read flow, from overview to details back to calls-to-action. Bleed setups guarantee edge-to-edge prints that look executive-ready.
For collaborative edits, cloud-compatible formats shine, allowing annotations without version chaos. It's geared for precision - ruler guides snap elements perfectly, ensuring axes align across panels. Ultimately, it empowers you to spotlight patterns that drive strategies, not just report figures.
Chart your path to clearer communications - download today and graph your success.
Frequently Asked Questions
What types of graphs are pre-built in this template?
It includes editable bar, line, pie, and scatter graphs, ready for data import from tools like Excel.
Is the design scalable for larger print runs?
Yes, vector-based elements ensure sharpness at any size, from 11x8.5 folds to unfolded posters.
Can I import live data from spreadsheets?
Absolutely - copy-paste into placeholders, and the linked objects update visuals automatically in Illustrator.
How editable are the text and labels?
Fully - stratified text layers allow independent styling, with consistent fonts for professional polish.
What's ideal for printing financial brochures?
Heavyweight 100 lb cover stock in matte finish conveys durability, matching the theme's analytical tone.