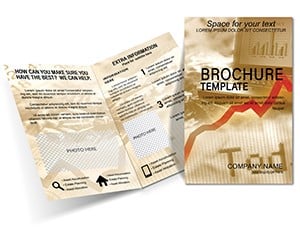
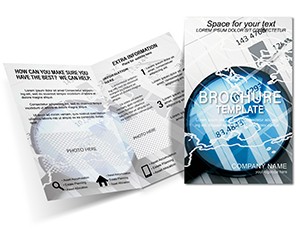
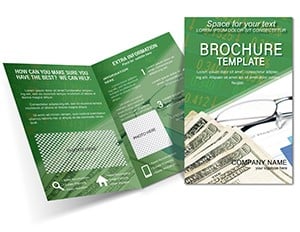
Trading and Market Trends Brochure Template: Decode Market Insights
Type: Brochures template
Category: Finance - Accounting
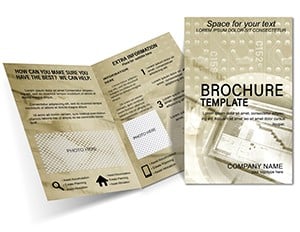
Fold type: Half Fold
Sources Available: .ait, .dotx, .indt, .jpg
Page size: 11x8.5
Product ID: BT00161
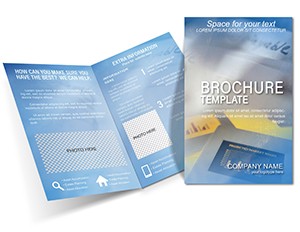
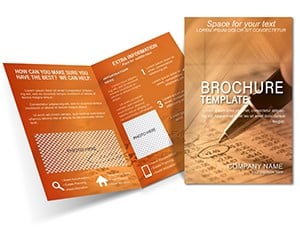
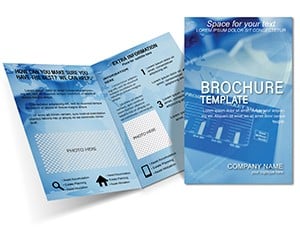
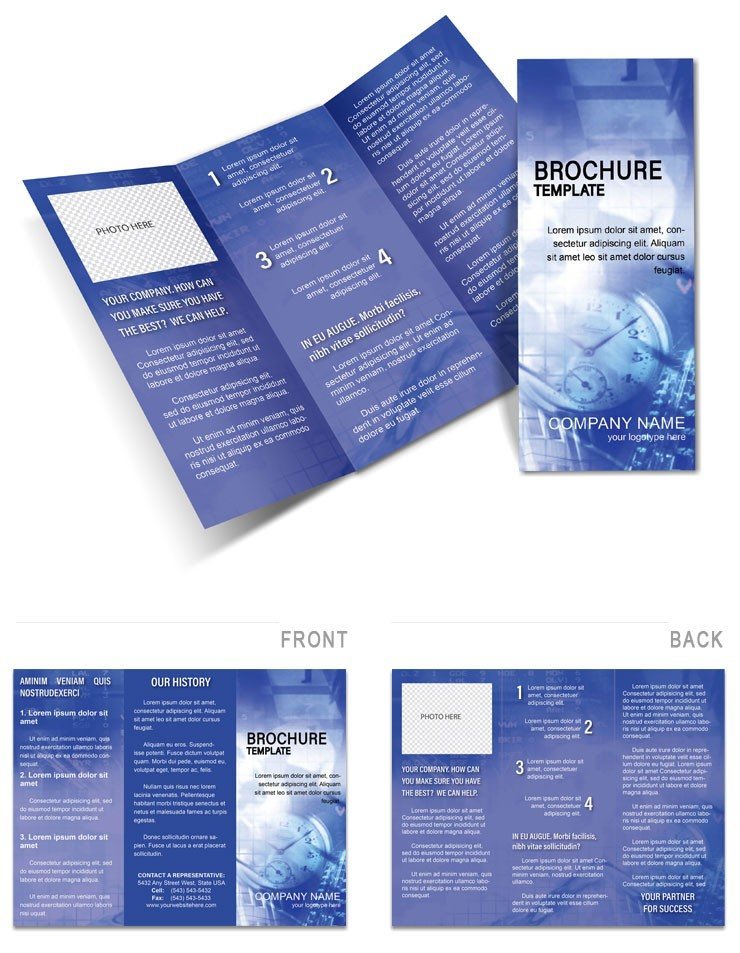
In the dynamic realm of finance, staying ahead of market trends is crucial for informed decisions. Our Trading and Market Trends Brochure Template is ideal for analysts, investors, and accounting professionals compiling reports for full-year or interim periods - monthly, quarterly, or semi-annually. This half-fold, 11x8.5-inch design in .ait, .dotx, .indt, and .jpg formats offers editable charts and text, enabling you to present data with clarity and impact. Drawing from Bloomberg`s trend analysis methodologies, it helps visualize fluctuations in stocks, commodities, or currencies.
Imagine using this at investor meetings: It turns raw data into compelling stories, highlighting patterns that drive strategies. For finance teams, it streamlines reporting, saving time while enhancing professionalism. Addressing issues like data overload, the template uses concise visuals to make trends accessible, potentially improving stakeholder engagement and decision-making speed.
Core Features for Data-Driven Narratives
Front panel teases key trends with a graph icon; insides break down data periods.
- Dynamic Charts: Insert customizable graphs for trend visualization.
- Flexible Formats: Edit in pro tools for precise outputs.
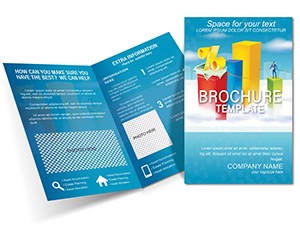
- Themed Icons: Enhance with market symbols like arrows or bars.
- Efficient Layout: Half-fold for focused, portable info.
Better than basic Excel exports, it provides polished designs with natural LSI like "economic indicators."
Layout Details for Effective Reporting
Front: "Navigating Market Trends" headline with summary stats.
Inside left: Timeline of periods - monthly breakdowns with examples from S&P reports.
Inside right: Analysis tips, like spotting bull markets.
Back: Sources, contacts, CTA for subscriptions.
Use Cases in Finance and Trading
For brokers, detail commodity trends; for firms, quarterly reviews.
Steps: 1) Load data into template. 2) Customize visuals. 3) Print/share. 4) Analyze feedback. Links to trading software.
Example: A hedge fund used similar formats to predict shifts, per WSJ cases.
Enhancement Tips and Strategies
Use colors for up/down trends. Opt for gloss paper. Wit: Trends go up and down - like a good stock, this template rises above!
Harness Trends for Success
This template equips you to turn data into actionable intelligence.
Uncover market secrets - download and analyze today.
Frequently Asked Questions
- How do I add custom charts?
- Insert via editable layers in the software.
- What periods can it cover?
- Monthly, quarterly, semi-annual, or annual.
- Is it investor-friendly?
- Yes, with clear visuals for all levels.
- Can I go digital?
- Export to interactive PDFs.
- Best for which markets?
- Stocks, forex, commodities - adaptable.
- Includes data examples?
- Placeholders for your inputs.