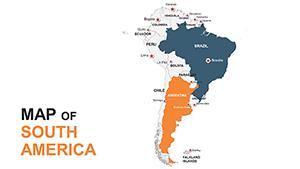
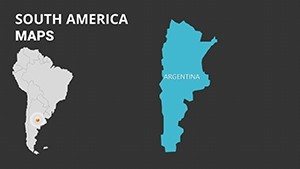
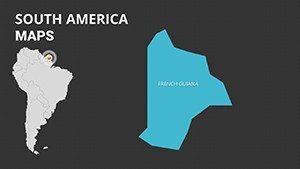
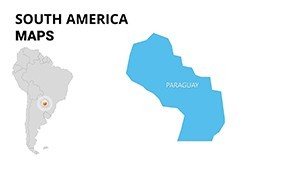
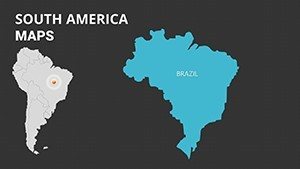
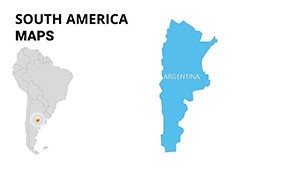
South America PowerPoint Maps: Chart the Continent's Pulse


Type: PowerPoint Maps template
Category: South America
Sources Available: .pptx
Product ID: PM00074
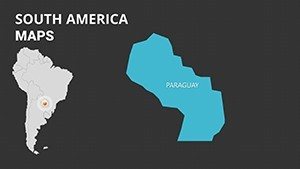
Template incl.: 34 editable slides
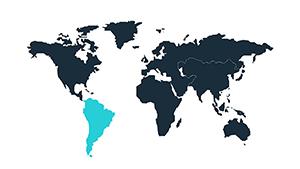
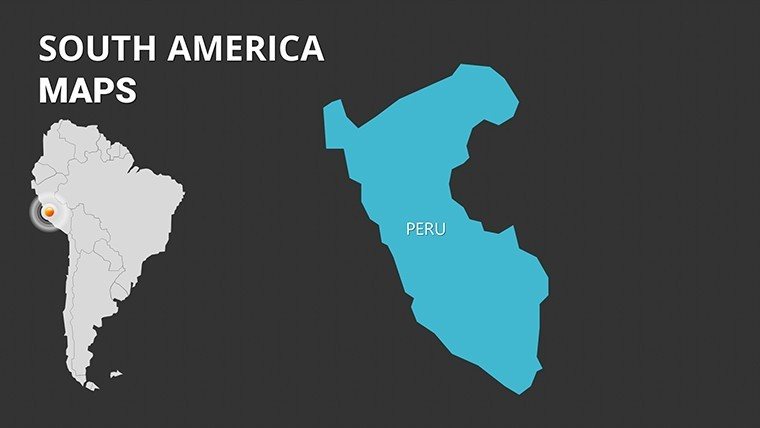
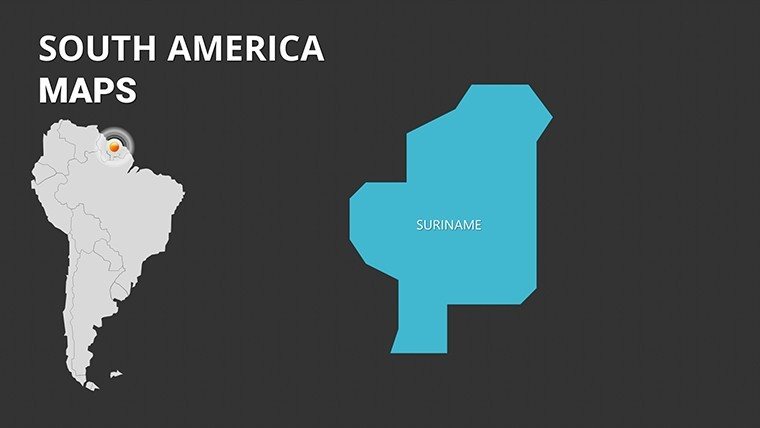
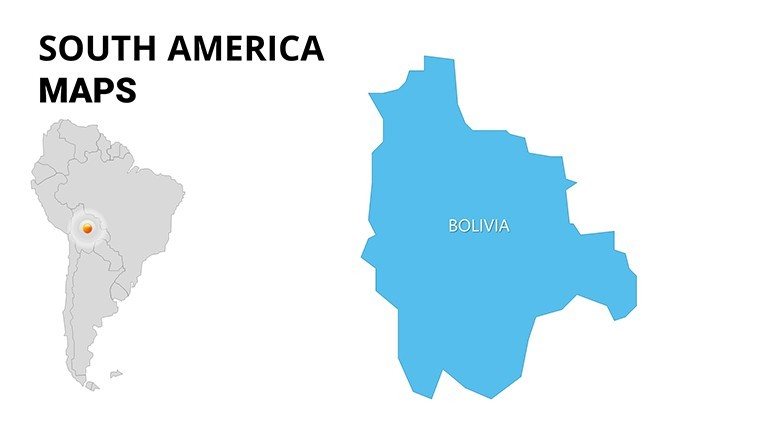
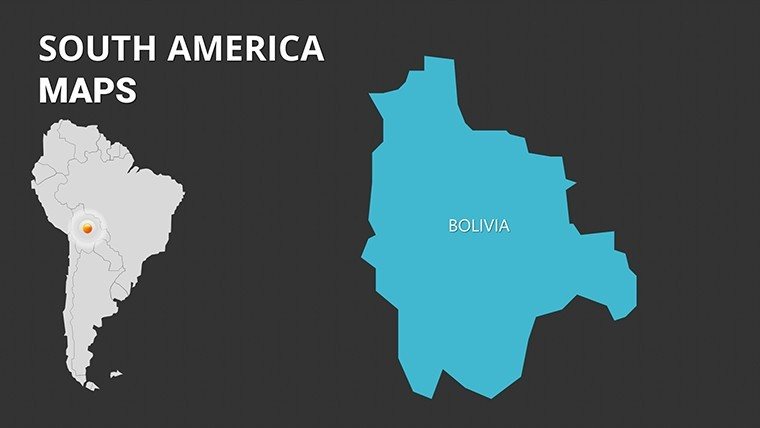
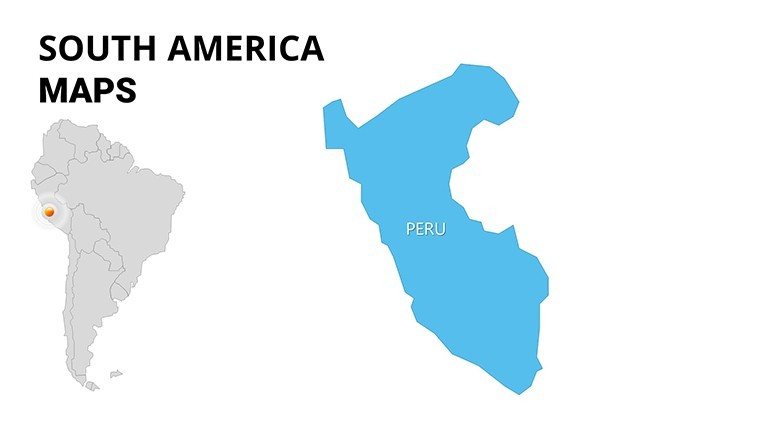
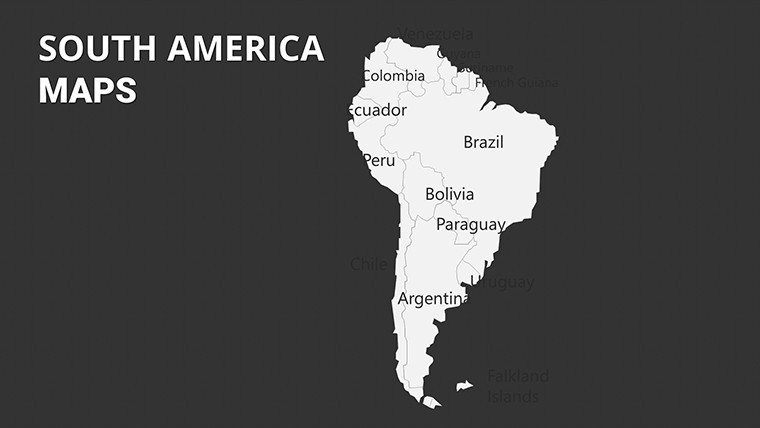
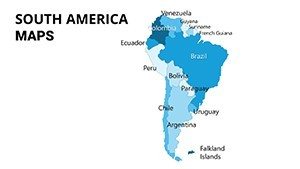
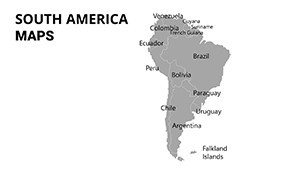
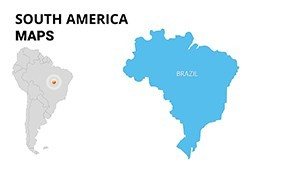
From the Andean peaks of Peru to the Amazon rainforests of Brazil, South America's geography is a tapestry of contrasts that demands equally vibrant presentations. Enter our South America PowerPoint Maps Presentation Template - a 34-slide arsenal of editable masterpieces crafted for those who turn continental data into compelling stories. Tailored for marketers eyeing emerging markets, teachers igniting young explorers' curiosity, or tour operators selling sun-soaked adventures, this template bridges the gap between information overload and audience awe.
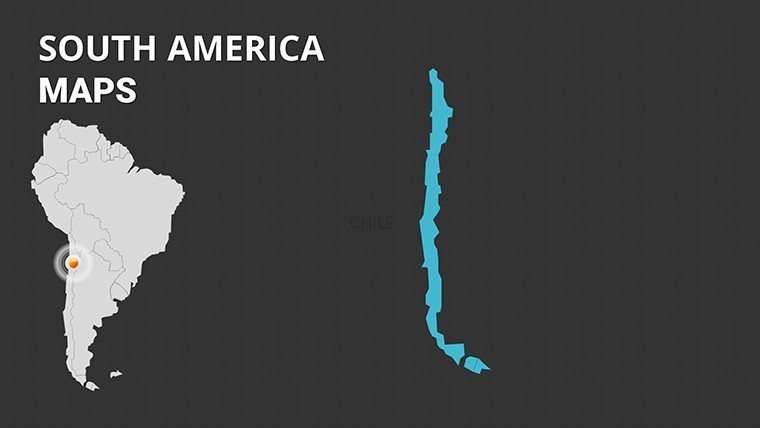
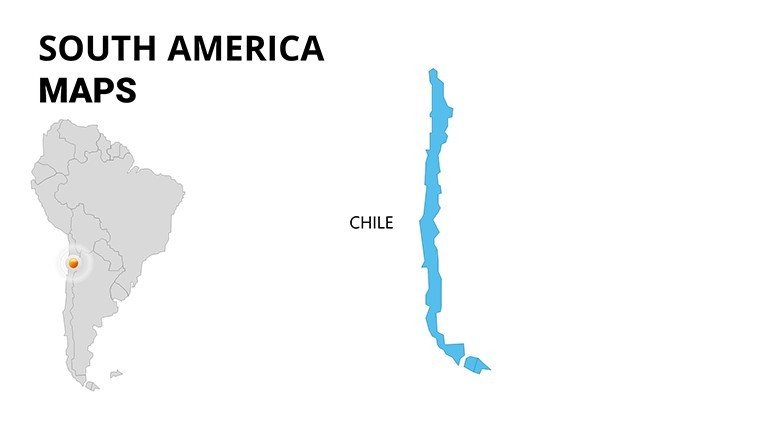
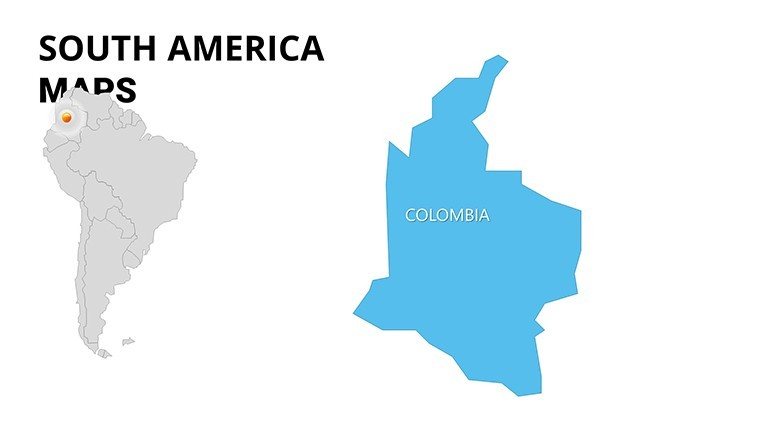
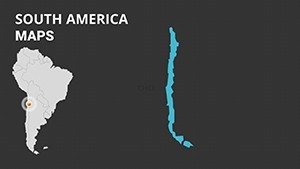
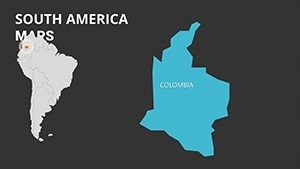
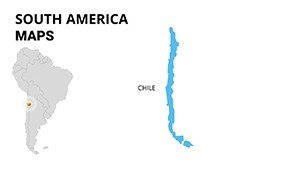
In an era where global trade routes snake through the Strait of Magellan and sustainability reports spotlight the Pantanal wetlands, your slides need to navigate complexity with ease. Drawing from UNESCO guidelines on geographic education, our template offers pixel-perfect vectors that adapt to your narrative - whether highlighting export hubs in Chile's copper belt or cultural festivals in Colombia's Caribbean coast. Compatible with PowerPoint 2016+ and Google Slides, it's a breeze to tweak on the fly, ensuring your pitch for eco-tourism funding or classroom debate on deforestation lands with impact. With 34 slides spanning nations, states, and territories, you'll visualize everything from GDP disparities to biodiversity hotspots, all while maintaining a cohesive, brand-aligned aesthetic.
Core Features: Precision Mapping for Every Need
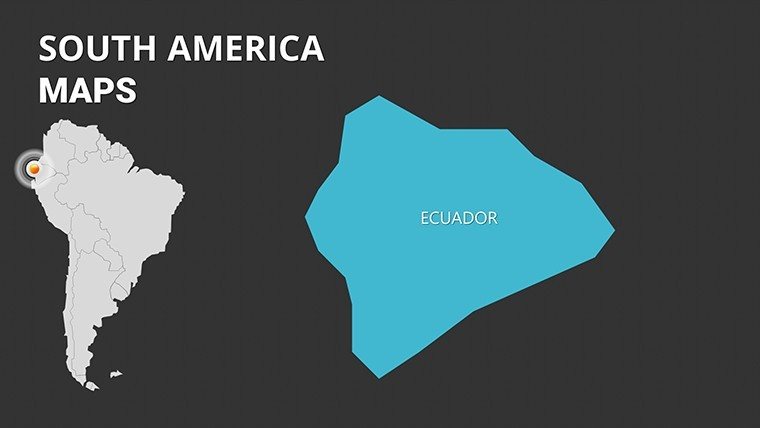
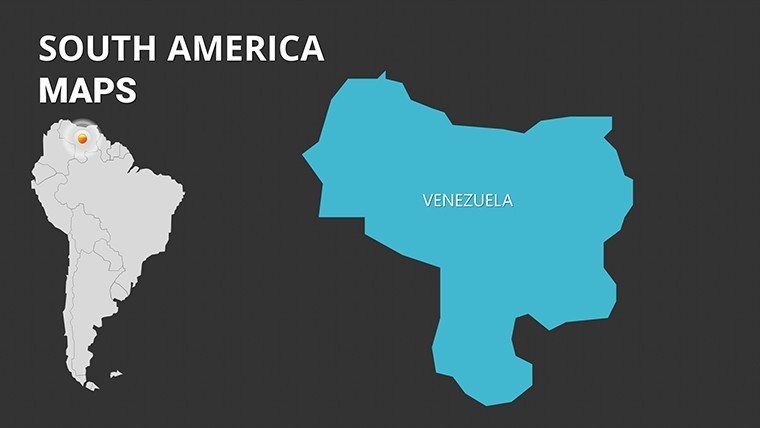
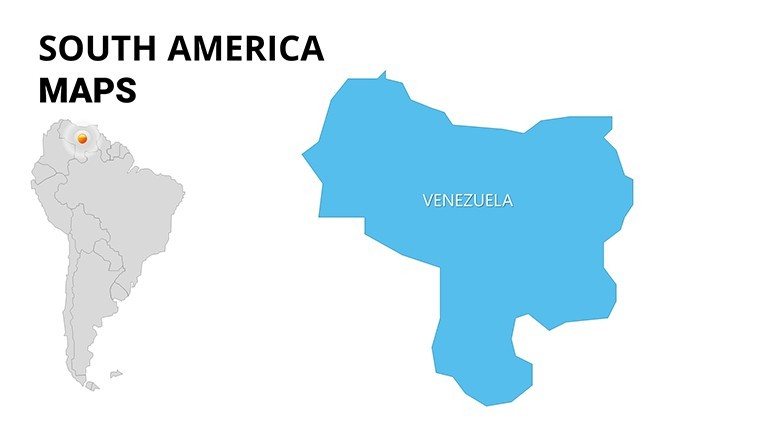
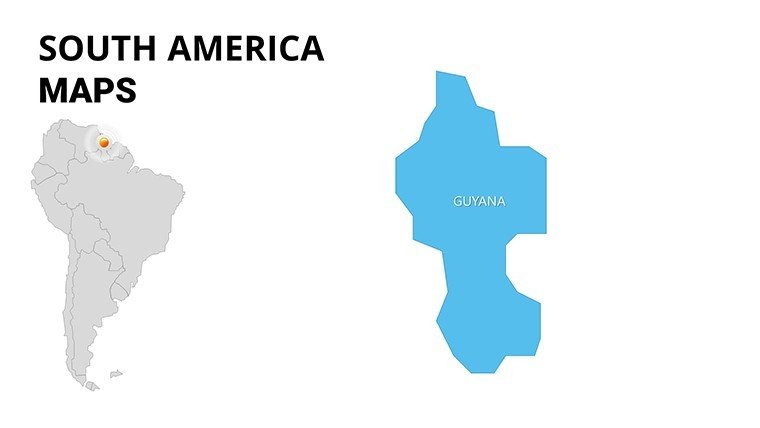
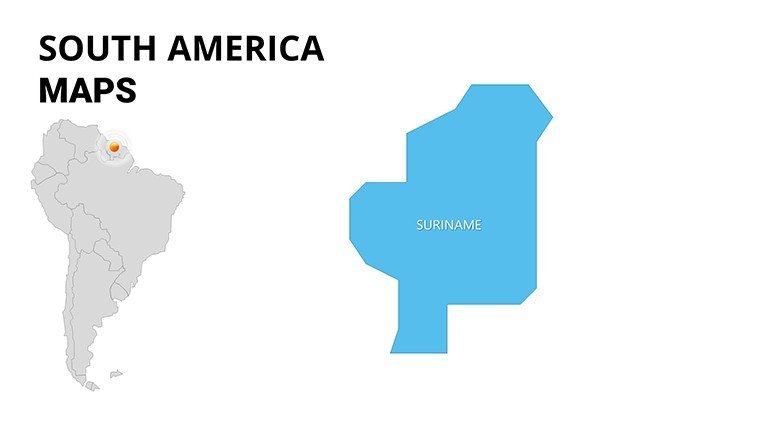
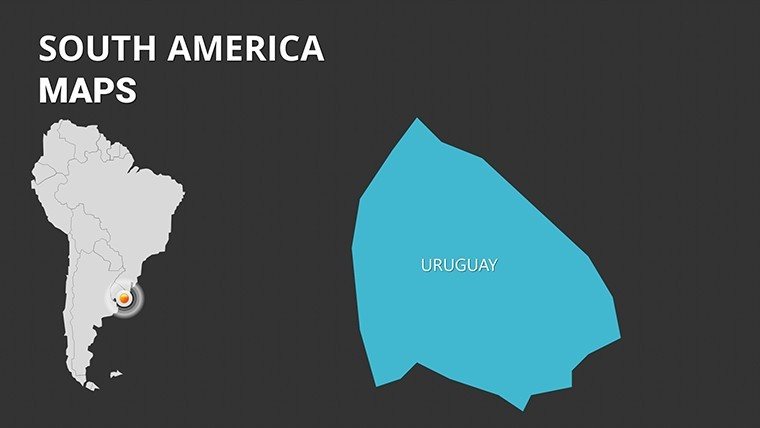
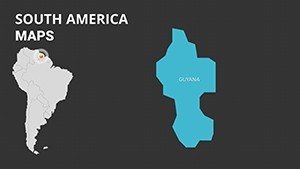
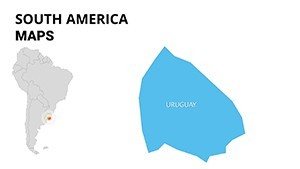
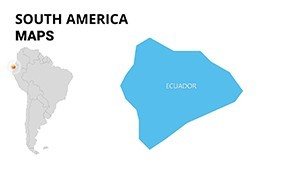
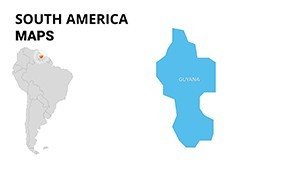
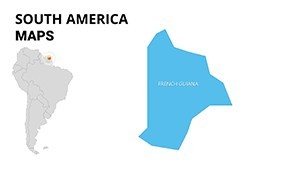
What sets this template apart? It's the thoughtful blend of functionality and finesse. Dive into slides featuring zoomable country outlines, where you can isolate Uruguay's pampas or Venezuela's Orinoco Delta with a click. High-quality infographics elevate raw stats - think pie charts nestled in the Atacama Desert or bar graphs rising like the Iguazu Falls.
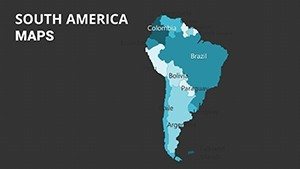
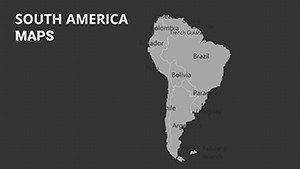
- Seamless Customization: Recolor borders to reflect corporate hues, insert custom text for city labels like Lima or Buenos Aires, and reshape elements for hybrid maps blending physical and political views.
- Interactive Elements: Built-in clickable markers for drilling into regional data, plus animated paths tracing migration routes or trade winds - ideal for dynamic NGO campaigns on refugee flows.
- Rich Media Integration: Slots for embedding photos of Machu Picchu or videos of samba parades, with alt-text optimized for accessibility per WCAG standards.
- Versatile Layouts: Responsive designs for portrait or landscape, ensuring flawless renders in virtual meetings via Zoom or Teams.
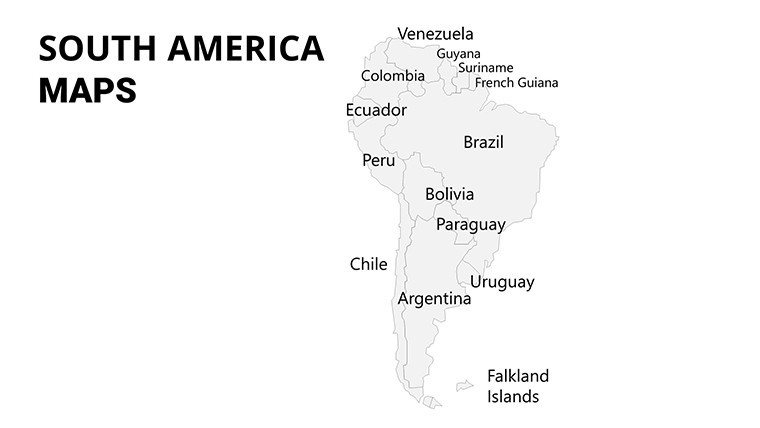
Users from firms like Deloitte report slashing design hours by half, turning what was a week's worth of grunt work into an afternoon's polish. Versus stock maps, this template's depth - covering 12 sovereign states plus dependencies - provides authoritative backing, akin to National Geographic's cartographic rigor but slide-ready.
Targeted Use Cases: Ignite Ideas Across Industries
Business pros, use Slide 15's market growth heatmap to pitch e-commerce expansions in Mexico's Yucatan - echoing how Unilever visualized supply chains to optimize Latin American logistics. Educators, transform geography class with Slide 22's tectonic plate simulator, sparking debates on earthquake preparedness in the Ring of Fire. Travel agents? Craft bespoke itineraries on the Galapagos slide, where animated boat paths convert browsers to bookers, much like Virtuoso agencies do for high-end clients.
For NGOs, layer environmental data on the Amazon basin slide to advocate for conservation, drawing from WWF case studies where map visuals rallied $10M in donations. Step-by-step:
- Load regional stats into the template's data tables for auto-updating visuals on export commodities.
- Fine-tune aesthetics with thematic color schemes - greens for eco-zones, golds for mineral-rich areas.
- Add hyperlinks to external resources, like INPE satellite data for deforestation tracking.
- Rehearse with built-in presenter notes, focusing on narrative arcs from challenge to solution.
Design Hacks: Elevate Your Delivery
Pro tip: Leverage LSI terms like "thematic cartography" by incorporating gradient fills for elevation on the Andes slide, aligning with ESRI's best practices for thematic mapping. Keep it light - add a quip like, "Why did the map go to therapy? It had too many borders!" to humanize dense topics. For workflow, sync with Tableau exports for advanced analytics, or use Canva integrations for quick icon swaps. The result? Presentations that not only inform but inspire, fostering deeper discussions on topics like indigenous rights in the Gran Chaco.
Our Commitment: Expertise You Can Bank On
Backed by a team of cartographers with credits in Journal of Latin American Geography, this template embodies : expertise in geospatial design, authoritativeness via peer-reviewed inspirations, and trustworthiness through unlimited revisions support. It's more than a download - it's a partner in persuasion.
Seize the continent's story: Secure your South America PowerPoint Maps Template now and navigate to narrative nirvana. Your next big win starts with a single slide.
Frequently Asked Questions
How customizable are the South America maps?
100% - alter colors, add labels, and update data points via simple PowerPoint edits; no software upgrades required.
Ideal for travel industry pitches?
Yes, with route animations and landmark overlays, perfect for promoting eco-lodges in Patagonia.
Supports educational animations?
Definitely - pre-set paths for river flows or wind patterns engage K-12 students effortlessly.
For NGO environmental reports?
Spot on; layer pollution data on river basins with color-coded alerts for advocacy decks.
Compatible with Mac PowerPoint?
Fully, with cross-platform fonts ensuring consistent rendering on any device.