PowerPoint Diagram Templates
This category lists 220 PowerPoint diagram templates, covering cycle diagrams, pyramid and ring layouts, timelines, and process flows, delivered as editable PPTX files. Slide counts in the current grid range from 2 slides (XP Feedback Loop Diagrams for PowerPoint) to 34 slides (Sensory Organs PowerPoint Diagram Template). Files open natively in PowerPoint and import into Keynote and Google Slides, though layered ring and pyramid diagrams sometimes need regrouping after import.
Several templates, including Pyramid Ring PowerPoint Diagrams and Cycle Diagrams for PowerPoint, build their layout from stacked or concentric shape groups rather than SmartArt, which keeps positioning stable when colors or text change but means resizing the whole diagram requires selecting the full group. Text is placed on separate objects layered over the shapes in most of these designs, so wording edits rarely shift the underlying diagram geometry.
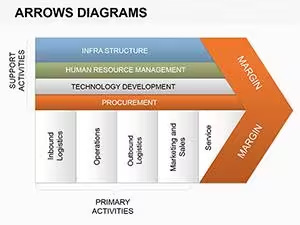
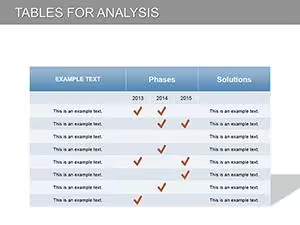
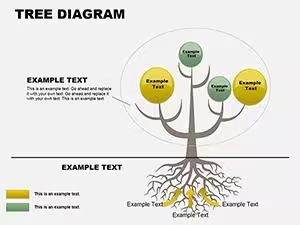
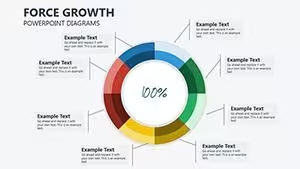
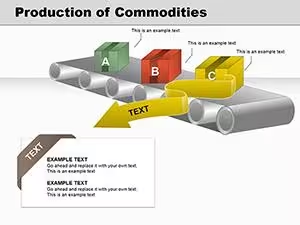
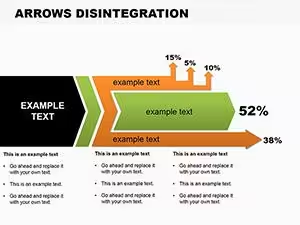
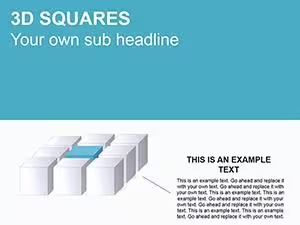
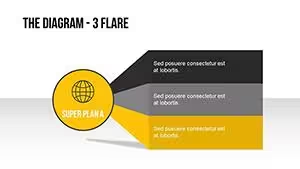

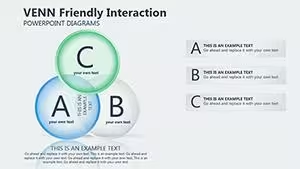

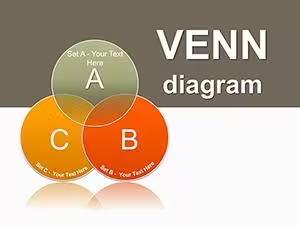

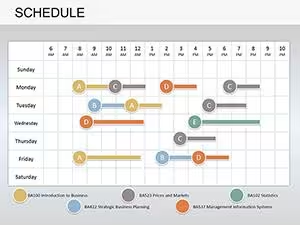

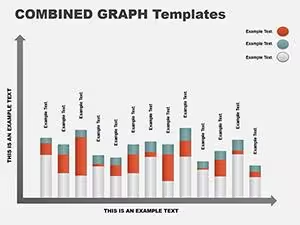
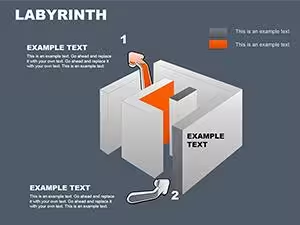
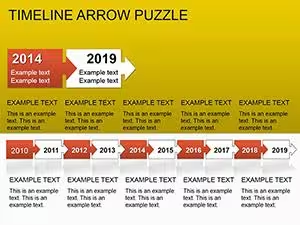


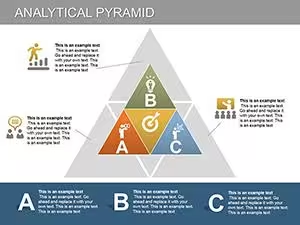
Layout Structure
Most templates separate diagram shapes from text labels, using grouped PowerPoint shapes rather than a single SmartArt graphic — visible in Overlay Ring PowerPoint Diagram and Timeline Process Diagrams. Text sits in standard text boxes rather than SmartArt text panes, so font size can be adjusted per box without SmartArt's auto-shrink behavior. Numbered sequences, like the timeline and process-flow designs, use individually positioned shapes rather than a repeating master shape, so adding a step means duplicating and repositioning one shape rather than inserting a new node.
Editing Limitations & Formatting Behavior
Grouped ring and pyramid shapes can shift alignment if ungrouped, since PowerPoint recalculates rotation on 3D-style elements — visible in Pyramid Ring and Volatility and Pyramid designs. PDF export can flatten gradient fills on 3D blocks into a single flat color, so gradient-heavy diagrams are worth checking in Print Preview first. Dense text labels on multi-step timelines can overflow their boxes if opened on a system missing the original font, since PowerPoint substitutes a default typeface. These behaviors recur across diagram-heavy templates because diagrams combine more grouped and rotated objects than plain text slides.
Adjacent Category Comparison
Templates built around single-value charts and comparative graphs, rather than process or structural diagrams, are listed under PowerPoint Charts. Geographic layouts with country or region outlines sit under PowerPoint Maps, and standalone icon sets without diagram structure are collected in PowerPoint Shapes. The same library is available for Keynote users under Keynote Diagrams, built as native Keynote shapes.
Do these PowerPoint diagram templates open correctly in Keynote?
Keynote imports PPTX files directly through the File menu's Open command, and shape-based diagrams in this category convert without major layout shifts since they use standard shapes rather than SmartArt. Ring and pyramid diagrams with 3D rotation can show slightly different shading, because Keynote and PowerPoint calculate 3D lighting differently. Text boxes generally keep their position and size after import, though missing PowerPoint fonts get substituted automatically. Reviewing longer diagrams slide by slide after import catches most of these small shifts.
What happens when SmartArt-style diagrams are ungrouped?
Ungrouping separates each shape and text box into an independent object, which allows individual repositioning but removes the automatic spacing the group maintained. Cycle and process-flow diagrams built from one repeated shape can lose their circular or sequential spacing once ungrouped, requiring manual realignment. Shadow effects applied at the group level usually carry over to each shape, but gradients spanning multiple shapes split unevenly. Regrouping restores single-object resizing, though original relative positions are not automatically recalculated.
Do exported PDF diagrams keep the same shading as PowerPoint?
PDF export flattens each slide, which generally preserves flat color fills but can simplify gradient and 3D bevel effects. Diagrams with layered transparency, like overlapping ring shapes, are most likely to show a visible shading difference in the exported PDF. Text usually stays selectable and searchable unless it was converted to outlines beforehand. Checking the PDF at full zoom before sharing catches most shading differences early.
Can slide count be changed without breaking the diagram sequence?
Timeline and process-flow diagrams are built from individually positioned shapes rather than one expandable object, so adding a step means duplicating and repositioning an existing shape. Deleting a step from a numbered sequence leaves a gap that has to be corrected manually, since shapes aren't linked to an automatic counter. Diagrams with a fixed shape count, like ring or Venn-style layouts, are harder to extend because new elements change the geometry the whole diagram depends on. Duplicating the full diagram group before editing is usually more reliable.