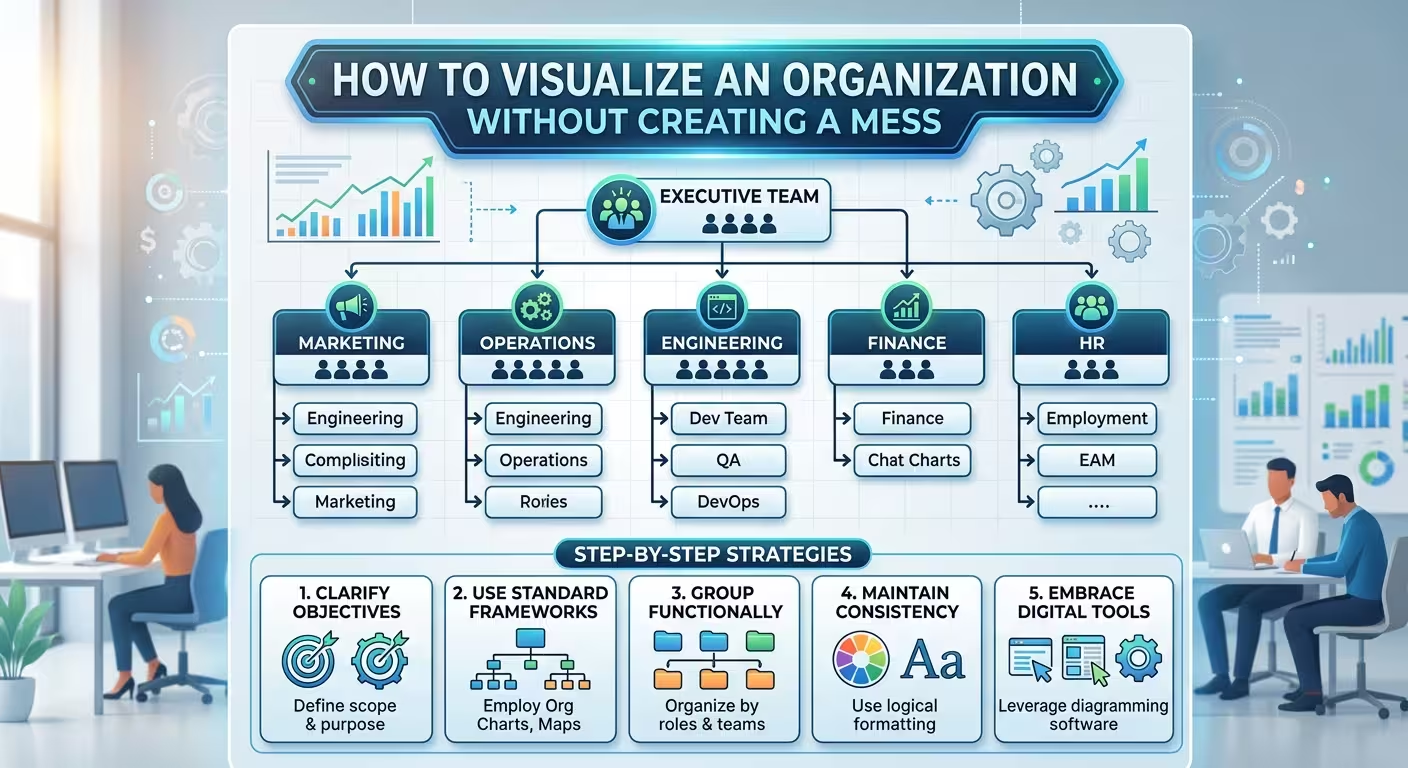
The problem is rarely the number of people
An organization can contain hundreds of people and still be easy to explain on one slide. Another organization can have only fifteen names and produce a diagram that nobody wants to read.
The difference is usually not the size of the organization. It is how much information the diagram is trying to communicate at the same time.
A typical organizational chart tries to answer one question: who reports to whom? But presentation slides often need to answer several different questions at once: which teams exist, where responsibility sits, who owns a function, how departments interact, and where a particular person fits.
When all of those relationships are drawn as boxes and connecting lines, the slide quickly becomes a visual mess.
The solution is not to make every box smaller. It is to decide which relationship the audience actually needs to see.
Choose the relationship before choosing the diagram
Start with the question the audience should be able to answer after looking at the slide.
If the answer is “Who reports to the CEO?”, you need a hierarchy. If the answer is “Which teams are responsible for these functions?”, a grouped structure may be more useful. If the answer is “How do these departments work together?”, a conventional organizational chart may actually be the wrong visual.
This distinction matters because different relationships require different visual grammar.
- Hierarchy: shows levels of authority or reporting.
- Grouping: shows departments, functions, or business units.
- Responsibility: shows who owns a task or area.
- Collaboration: shows relationships that do not follow the reporting hierarchy.
- Process: shows how work moves between teams rather than where people sit in the organization.
Imagine a product organization with Product, Engineering, Design, Marketing, Sales, and Customer Success. If the purpose of the slide is to explain the formal reporting structure, connecting every department to every other department creates noise.
If the purpose is to explain how a product reaches the customer, however, the reporting hierarchy may be almost irrelevant. A process or relationship diagram could communicate the organization more honestly.
ImagineLayout's own PowerPoint diagram guidance starts from the same decision: identify whether the relationship is a sequence, hierarchy, comparison, cycle, or connection before opening the Shapes menu. The relationship should determine the diagram structure, not the other way around.
Do not put the entire organization on the main slide
One of the most common mistakes is treating the presentation slide as a substitute for the company's HR database.
If the organization has 80 people, the designer tries to find a clever way to fit all 80 people onto one slide. The result usually involves tiny names, compressed boxes, long connector paths, and enough visual density to make the slide technically complete but practically useless.
A presentation does not need to contain every available detail.
A better approach is to establish levels of information.
- Level 1: leadership or the top organizational structure.
- Level 2: major functions or business units.
- Level 3: key teams or responsibilities.
- Level 4: individual names and detailed reporting relationships, only when the audience needs them.
The main slide can therefore show the structure at the level relevant to the meeting. Detailed team charts can follow on subsequent slides.
This is not hiding information. It is separating orientation from inspection.
A leadership presentation may need to show six functions. An onboarding presentation may need to show the people inside one of those functions. A restructuring presentation may need to show only the positions that are changing.
The same organization can therefore require several different visualizations depending on the question being asked.
Use grouping before you start drawing connectors
Suppose you have twelve boxes representing twelve teams. The instinct is often to connect them immediately.
Don't.
First establish the groups.
For example, instead of showing twelve isolated boxes, you might visually organize them into four functional areas:
- Product
- Technology
- Commercial
- Operations
Within each group, the relevant teams can be shown at a smaller visual level.
This changes the viewer's first impression. They see four organizational blocks rather than twelve unrelated objects.
Only after the groups are clear should you decide which reporting relationships need connectors.
This is important because connectors have a cost. Every additional line creates another visual relationship for the audience to decode. When several lines cross the same area, the viewer stops seeing organizational structure and starts tracing geometry.
One of the practical principles in PowerPoint diagram construction is therefore to establish the spatial skeleton first and add connectors only where they carry meaning. PowerPoint's connector tools are especially useful when the structure will be edited later, but even a perfectly attached connector is still unnecessary if the relationship does not need to be shown.
Make hierarchy visible without making every person equal
An organizational chart has a subtle problem: rectangles naturally make things look equivalent.
Put the CEO, a department head, and an individual contributor into three identical boxes, and the visual system says they deserve roughly the same attention. The connector hierarchy may technically communicate their positions, but the boxes themselves compete for attention.
You can solve this without creating a different color for every level.
Use controlled differences in scale and treatment.
The highest level can have stronger visual weight. Major functional leaders can share one treatment. Individual teams can use a quieter version. Supporting information such as job titles can be reduced in size rather than given another color.
The important point is that visual hierarchy should reinforce organizational hierarchy.
For example, if the purpose of the slide is to introduce the executive structure, the CEO should not have the same visual weight as twenty downstream roles. If the purpose is to explain the design department, however, the design lead may deserve more emphasis while the rest of the company becomes contextual background.
The hierarchy can therefore change according to the presentation's purpose even though the underlying organization has not changed.
Separate reporting lines from working relationships
This is where many organizational charts become difficult to read.
A person may report to one manager but work closely with three other teams. If you draw all four relationships with identical solid lines, the audience can no longer tell which one represents formal authority.
Use different visual languages for different relationship types.
- Solid connector: formal reporting relationship.
- Secondary or lighter connector: supporting relationship.
- Dashed connector: collaboration, dotted-line responsibility, or another clearly defined secondary relationship.
- No connector: use proximity or grouping when the relationship does not need to be explicitly drawn.
The exact line style is less important than consistency. If a dashed line means collaboration on one side of the chart, it should not mean reporting on the other side.
This is one reason an organizational chart should not be treated as a collection of decorative boxes. Every visual distinction needs a stable meaning.
If the audience has to ask what the lines mean, add a small legend. If the legend becomes almost as complicated as the organization itself, that is a signal that the diagram is probably carrying too many relationship types.
Know when an organizational chart is the wrong visual
Sometimes the cleanest organizational visualization is not an organizational chart.
Consider a company explaining a new operating model. The important question may not be “who reports to whom?” It may be “how do these capabilities work together to deliver the result?”
A traditional hierarchy can obscure that story because it gives formal reporting relationships more visual importance than operational relationships.
Other formats can work better:
- Swimlanes when responsibility across teams matters.
- Process diagrams when work moves between functions.
- Hub-and-spoke diagrams when one central function coordinates several groups.
- Matrix layouts when two dimensions genuinely need to be compared.
- Grouped structures when the main point is the organization's functional architecture.
The danger is choosing a visually impressive format that changes the meaning of the organization.
A circular arrangement may look modern, for example, but it can imply that every department has an equivalent role or that the organization operates as a cycle. If the real structure is hierarchical, the visual metaphor is working against the information.
The best organizational visualization is therefore not necessarily the most original one. It is the one whose geometry agrees with the relationship being explained.
Let the slide explain the organization at one level at a time
Complex organizations often become much easier to present when the structure is split across slides.
For example, a hypothetical presentation about a large company might use:
- Slide 1: executive structure and major functions.
- Slide 2: Product and Technology structure.
- Slide 3: Commercial organization.
- Slide 4: detailed responsibility model for one critical function.
The audience first learns the map, then zooms into the relevant territory.
This is usually more effective than shrinking the entire organization until every name technically fits.
The same principle appears in process diagrams. When a process contains a main path, exceptions, multiple teams, and detailed rules, putting everything on one slide often produces a diagram that technically fits but cannot be followed. Splitting the structure into levels is often the cleaner solution. The same approach works for organizational structures when detail starts competing with the main hierarchy.
Build the visual system before styling individual boxes
If you have twenty boxes, do not format them one at a time.
Decide the visual rules first:
- one shape language;
- one typography hierarchy;
- one treatment for equivalent organizational levels;
- one connector system;
- one method for highlighting the important unit;
- one spacing rule for equivalent groups.
Then apply those rules systematically.
This makes revisions much easier. Organizations change. A department moves. A manager changes. Two teams merge. A new function appears.
A diagram designed as a system can absorb those changes. A diagram designed as twenty individually decorated boxes becomes fragile.
This distinction is particularly important for presentation designers. The quality of an organizational chart should not be judged only by the first screenshot. It should also be judged by what happens when the content changes.
ImagineLayout's broader discussion of professional presentation design makes this distinction explicit: an organizational chart may be easy to construct technically, while the difficult work lies in keeping it readable as the structure changes and in distinguishing primary reporting relationships from secondary ones. The real design problem is the set of decisions behind the apparently simple slide.
The final test: can someone explain the structure without reading every name?
Before presenting the slide, stop looking at the individual boxes.
Look at the organization from a distance.
Can you immediately identify the top level? Can you see the major functions? Can you tell which relationships are formal reporting lines and which are secondary? Can you identify the area the presenter is actually talking about?
Then hide the names mentally and look only at the geometry.
If the structure disappears when the text disappears, the visual system may be relying too heavily on labels.
A strong organizational slide should communicate its architecture before the audience reads every individual name.
That is ultimately the difference between an organizational chart and a useful organizational visualization. The first tries to fit the organization onto a slide. The second decides which part of the organization the audience needs to understand — and designs everything else around that decision.
Comments (0)