A colleague of mine spent an evening building a 40-slide investor deck. Every chart was pasted straight out of Excel as a static image — fast, clean, looked perfect in the preview. At 11 p.m., finance sent revised Q3 numbers. Every single chart had to be rebuilt by hand, because a picture doesn't know the spreadsheet behind it ever existed. That's not a formatting mistake. It's a decision made three steps earlier, at the moment of pasting, that nobody thought of as a decision at all.
Three Ways to Get a Chart Onto a Slide — and What Each One Actually Commits You To
PowerPoint gives you three fundamentally different outcomes when you paste from Excel, and the default one is rarely the right one for anything you'll touch again.
- Paste as a picture. Flattened, no connection to any data. Fine for a one-off screenshot in a document nobody will update. Useless the moment a number changes.
- Embed the workbook. A full copy of the Excel file gets baked into the .pptx. You can double-click the chart and edit the underlying data right inside PowerPoint — but that copy is now disconnected from your original spreadsheet. Update the real file, and the slide has no idea.
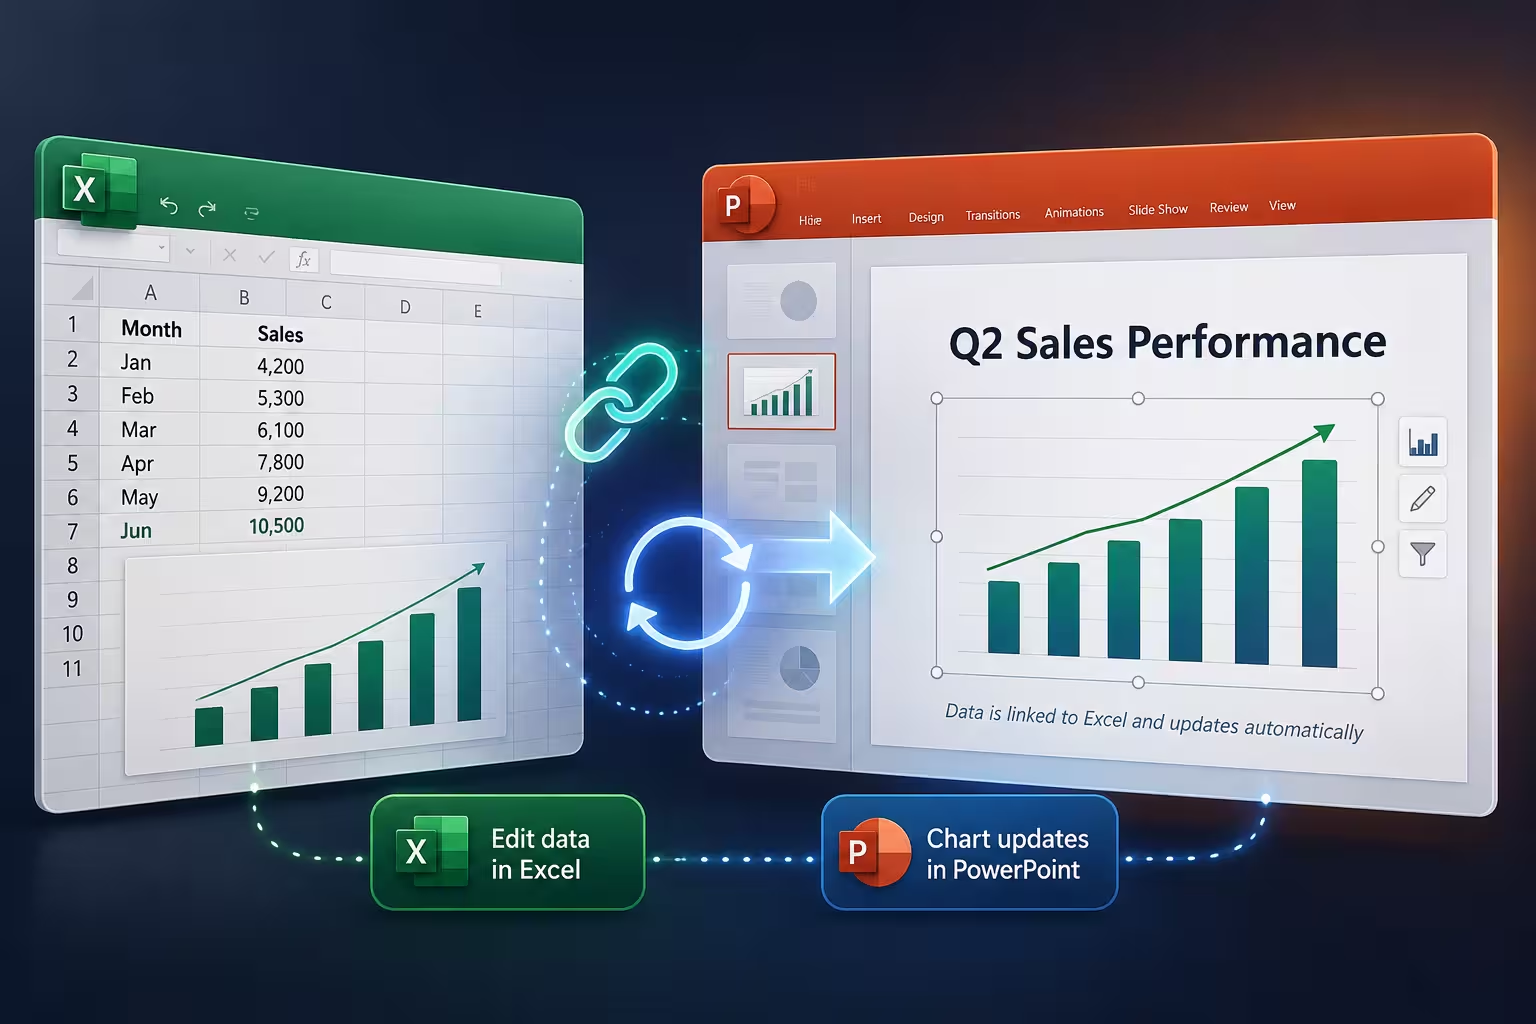
- Paste as a linked object. The slide keeps a live pointer to the source workbook. Change the numbers in Excel, and — as long as the file hasn't moved — the chart updates the next time you open the deck or hit refresh.
Most tutorials stop there, as if the choice is purely technical. It isn't. It's really a question about who owns the source file after today, and whether that file is going to sit still.
The Paste Special Route: Setting Up a Chart That Stays Connected
If you want the link, here's the sequence that actually works, not the shortened version people half-remember:
- In Excel, select the chart itself (click its border, not a cell) and copy it.
- In PowerPoint, go to Home > Paste > Paste Special.
- Choose Microsoft Excel Chart Object and select the Paste Link radio button — this is the part people skip, because the default dialog nudges you toward embedding instead.
- Click OK. The chart lands on the slide looking identical to the Excel version, but it's now tethered to the workbook.
Some free chart templates come with this already set up — the placeholder is pre-linked, so you paste your numbers into the attached workbook once and every slide referencing it updates together. It saves the step of remembering Paste Special exists at all.
Where the Link Quietly Breaks
Here's the part that catches people off guard. A linked chart works exactly as advertised — right up until you move the Excel file, rename it, or send the .pptx to someone without also sending the workbook. PowerPoint doesn't store the data; it stores a file path. Move the source even one folder over, and the next refresh shows old numbers with no error message telling you why.
This is where a lot of "just link it" advice quietly falls apart for team decks. If three people are editing a shared drive folder and someone reorganizes it, every presentation pointing to that workbook goes stale simultaneously, and nobody notices until a meeting. The fix isn't complicated — keep the source file in a fixed location before you build anything on top of it, and if you're sharing the deck externally, zip the workbook alongside it or switch to embedding for that copy specifically.
Making the Chart Look Like It Belongs on the Slide, Not in a Spreadsheet
A pasted chart carries Excel's default styling — its own font, its own blue-and-orange palette, gridlines that made sense in a worksheet and now compete with your slide background. When you paste, PowerPoint offers Use Destination Theme instead of Keep Source Formatting; picking destination theme pulls the chart into your deck's actual color scheme and typography automatically, rather than leaving it as a visitor from another program.
One thing people overlook: this option only appears for embedded and linked pastes, not static pictures. Another reason paste-as-image is the wrong default for anything beyond a single throwaway slide — you lose not just the data connection but the ability to restyle the chart without redoing it in Excel first.
When Embedding Is Actually the Better Call
None of this means linking wins every time. If the deck is a one-time deliverable — a proposal, a single client presentation that won't be revised after it ships — embedding is simpler and safer. There's no external file to lose track of, no broken path six months later when someone opens the old deck and wonders why the numbers look wrong. The trade-off is that updating the chart later means re-embedding fresh data by hand, which is exactly the tedious work linking was meant to avoid. Pick based on whether this deck has a future, not on habit.
A GfK-run survey of more than 1,000 office workers, commissioned by Made in Office, found that a large share of total time spent working in PowerPoint goes into formatting rather than content — chart and diagram formatting specifically called out as one of the biggest time sinks. That's the cost of rebuilding charts from scratch instead of setting up the link once. If your deck template already has chart placeholders built into the layout, you're removing one of those recurring formatting cycles before it starts — our PowerPoint chart templates collection is built around exactly that, and the analysis chart templates in particular are laid out for the kind of recurring, data-heavy reporting where a broken link costs you the most.
Next time you're about to paste a chart on autopilot, it's worth the extra two seconds to ask whether this slide is going to outlive today's numbers — that single question decides which of the three methods actually saves you time.
Comments (0)