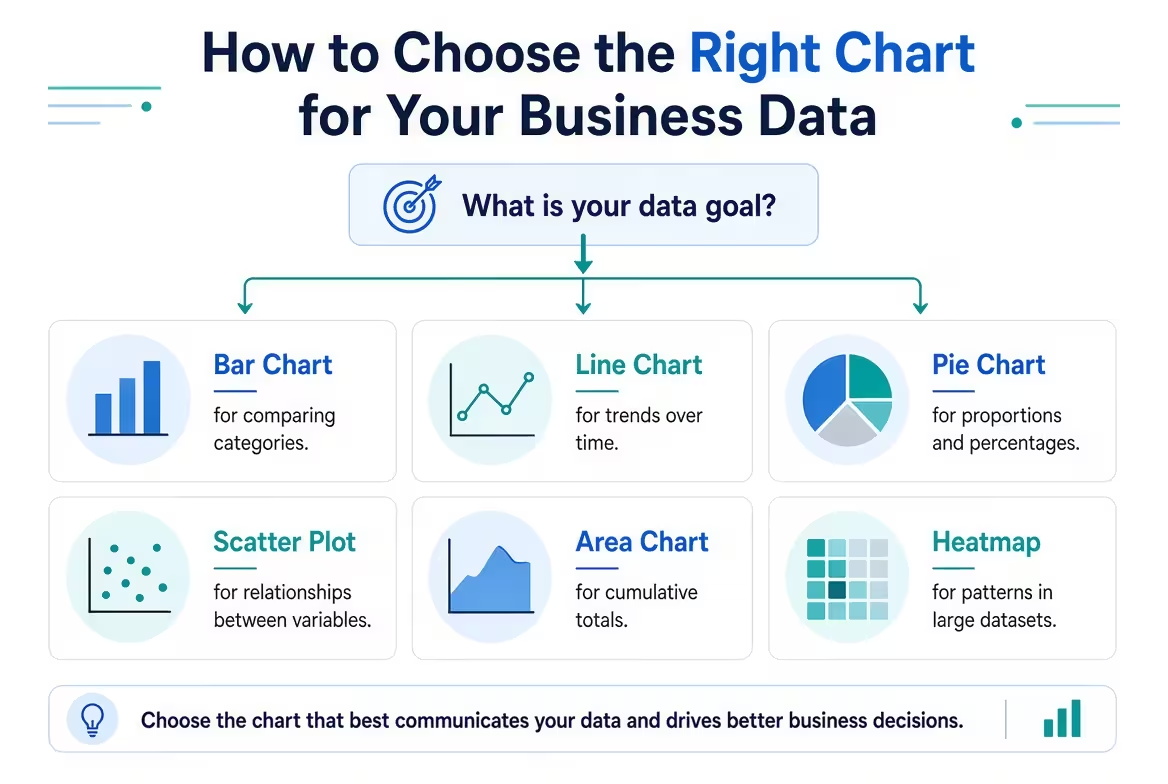
A spreadsheet can contain perfectly good numbers and still produce a terrible chart. The problem is often not the data — it is that the visual was chosen before anyone decided what the audience should notice.
If you are turning sales, financial, marketing, operational, or KPI data into a presentation, this guide shows how to choose the right chart for your business data by starting with the decision the chart needs to support. The goal is not to memorize dozens of chart types. It is to match the visual structure to the relationship you actually need people to see.
Start With the Question, Not the Chart
Imagine you have monthly revenue, regional sales, product margins, and customer acquisition data sitting in the same workbook. Opening the chart menu first gives you dozens of possibilities. That is exactly the problem.
Instead, finish this sentence before choosing anything:
“I need the audience to see…”
The ending usually reveals the chart family you need.
- Which category is larger? Use a bar or column chart.
- How has something changed over time? Use a line chart, or sometimes an area chart.
- How is a total divided? Use a stacked bar, 100% stacked bar, or occasionally a pie/donut chart.
- How are values distributed? Use a histogram or box plot.
- Are two variables related? Use a scatter plot.
- What caused a value to move from A to B? Use a waterfall chart.
- Where do two dimensions intersect? Use a heatmap or matrix.
This distinction matters because the same dataset can support several valid charts while only one may make the intended business point obvious. A sales table does not automatically call for a sales chart. First decide what the reader is supposed to compare, trace, or understand.
Use Bar Charts When the Decision Is About Ranking or Comparison
Suppose the question is: Which five regions generated the most revenue? That is a ranking problem, so a bar chart is usually more useful than a more decorative alternative.
Bars give the reader a common baseline and make differences between categories relatively easy to judge. Horizontal bars become especially useful when category names are long, when there are many categories, or when ranking is the main story.
There is an important distinction here: a chart showing which regions are largest is different from one showing how each region's composition changed. The first calls for direct comparison. The second may require a stacked chart.
For business presentations, I often treat sorting as part of chart selection rather than a finishing detail. If the purpose is ranking, sort the categories so the visual order reinforces the question. If the order itself carries meaning — for example, stages in a sales process — preserve that meaningful sequence instead.
A common failure happens when a comparison chart tries to show too many categories at once. At that point, the audience stops comparing and starts searching for labels. If the complete list matters, consider splitting the analysis or moving the detailed table elsewhere rather than shrinking the chart until everything technically fits.
Choose a Line Chart When the Shape of Change Matters
A monthly revenue chart can contain the same numbers as twelve columns, but the line version makes a different visual argument: it emphasizes the movement between observations.
Use a line chart when the order of observations matters, particularly for time series such as monthly revenue, weekly conversions, quarterly margin, or daily traffic. The connecting line tells the reader that the sequence itself is meaningful.
That creates a useful boundary: do not connect categories merely because they happen to be listed in an order. Connecting “North America, Europe, Asia, Latin America” with a line can imply continuity that does not exist. A bar chart is more honest when the categories are independent.
Line charts also become problematic when every available series is added. Five product lines may still be interpretable; a dozen competing lines can turn the chart into a tangle where the viewer cannot tell which movement matters.
When several series are necessary, ask whether the audience really needs to compare all of them simultaneously. Often the better presentation is to emphasize one series, group secondary series visually, or divide the analysis into two views.
Use Composition Charts Only When the Whole Actually Matters
“Product A is 40%, Product B is 30%, Product C is 20%, and everything else is 10%” is a composition question. But the fact that percentages add to 100% does not automatically make a pie chart the best choice.
The real question is whether the audience needs to understand the parts as proportions of one meaningful whole.
A stacked bar can be more useful when you need to compare composition across several groups. A 100% stacked bar is particularly useful when the absolute size of each group is less important than how its mix differs.
For example, imagine a hypothetical business comparing the same product mix across four regions. A single pie chart can show one region's composition, but four pies force the reader to compare angles and scan between separate circles. A 100% stacked bar can put the four regions into a common structure, making changes in mix easier to compare.
Pie and donut charts still have a place when there are only a few meaningful parts and the exact differences are not the main point. They become a poor choice when the audience needs precise comparison, when there are many slices, or when negative values are involved.
The practical test is simple: if the reader's first task is to compare segment sizes rather than understand one simple whole, try a bar-based composition chart first.
Switch to Scatter Plots When the Business Question Is About Relationships
Sometimes a table contains two important numeric variables and the interesting question is not “which is bigger?” but “do these two things move together?”
Consider a hypothetical dataset containing advertising spend and new customer acquisitions for several campaigns. A bar chart can rank the campaigns, but it cannot show the underlying relationship nearly as directly as a scatter plot.
Each point represents an observation, while its position reveals whether higher values of one variable tend to appear alongside higher or lower values of the other.
This is also where business presentations need more discipline. A visible pattern is not automatically a causal explanation. If two metrics move together, the chart can show an association; it does not by itself establish why the relationship exists.
Use scatter plots when the relationship itself is the subject. Add another visual encoding, such as point size or a carefully chosen category distinction, only when it answers a specific secondary question. Otherwise, extra dimensions can make the relationship harder to see rather than richer.
Use Distribution Charts When Averages Hide the Real Story
A business dashboard can tell you that the average delivery time is 4.2 days. That number may be accurate and still conceal the operational problem.
If most deliveries take two or three days while a smaller group takes ten or twelve, the average compresses two very different experiences into one number.
This is where a histogram or box plot can reveal something a standard KPI chart cannot: how the observations are spread.
Histograms are useful when you want to see the shape of a numerical distribution — for example, order values, delivery times, transaction sizes, or customer response times. Box plots become particularly useful when several groups need to be compared through their median, spread, and potential outliers.
These charts are often less familiar to executive audiences, so context matters. If the distribution itself is not relevant to the decision, showing it can add complexity without adding insight. But when an average is hiding meaningful variation, a distribution chart can change the conversation completely.
Use Waterfalls When the Audience Needs to Understand What Changed
There is a specific business question that neither a normal bar chart nor a line chart handles particularly well: “How did we get from this starting value to that ending value?”
A waterfall chart is designed for that bridge.
It works well for situations such as explaining the movement from budget to actual results, showing how several factors changed operating profit, or breaking a starting revenue figure into gains and deductions that lead to a final number.
The important distinction is that the chart is not primarily showing a list of values. It is showing a sequence of contributions to a change.
If the audience only needs to compare departments, a waterfall adds unnecessary structure. If the audience needs to understand which factors created the final variance, that same structure becomes the reason to use it.
This is a useful general principle for chart selection: a specialized chart earns its complexity only when the relationship it exposes would otherwise be difficult to see.
When One Chart Is Trying to Answer Two Questions, Stop
One of the most useful tests I use when reviewing business slides is to ask: What exactly should the viewer compare first?
If the answer contains two unrelated comparisons, the chart may be overloaded.
For example, a stakeholder may ask for a chart that shows both revenue growth by region and each region's product mix. Technically, one sophisticated visualization might encode both dimensions. Practically, that can force the audience to decode several visual rules at once.
There is nothing wrong with using two charts when the questions are genuinely different.
A strong presentation might show:
- one bar chart answering which regions generated the most revenue;
- one composition chart answering what those regions' revenue consists of.
The two visuals can share the same categories and visual language, so the audience experiences them as one analytical story rather than two unrelated graphics.
This is also where presentation templates can save time. ImagineLayout's PowerPoint Charts collection provides a range of chart layouts, which can be useful when the analytical decision has already been made and the remaining problem is building a presentation-ready visual structure.
Run the Chart Through a Final Business Test
Before putting the chart into a report or executive presentation, do not ask only whether it looks correct. Ask whether it makes the intended comparison obvious.
- Question: Can I state the business question in one sentence?
- Relationship: Does the chart show comparison, change, composition, distribution, relationship, or contribution?
- Priority: What should the viewer notice first?
- Precision: Does the audience need an approximate pattern or an accurate value comparison?
- Scale: Could the axis or visual encoding exaggerate the difference?
- Complexity: Are there more categories or series than the decision actually requires?
- Context: Can someone understand the units, period, and categories without a verbal explanation?
If the chart passes these questions, then styling becomes useful. Before that point, changing colors, adding icons, or choosing a more sophisticated template is mostly cosmetic work.
For teams working repeatedly with business dashboards, reports, or presentation decks, a reusable chart system can also reduce the temptation to invent a new visual for every dataset. ImagineLayout's Data Visualization Techniques PowerPoint Charts template is one example of a pre-built chart resource that can be adapted after the analytical structure has been decided.
For more analytical presentations, a broader collection such as Analytical Graphics PowerPoint Charts can provide different structures for KPIs, comparisons, trends, and other data-driven slides.
The best chart is rarely the most impressive one in the chart menu. It is the one that makes the intended business comparison so obvious that the audience does not have to spend time figuring out how to read it.
So the next time you have a spreadsheet open and a blank slide waiting, resist choosing the chart first. Write down what the audience needs to understand. Once that sentence is precise, the range of sensible chart choices becomes surprisingly small.
Comments (0)