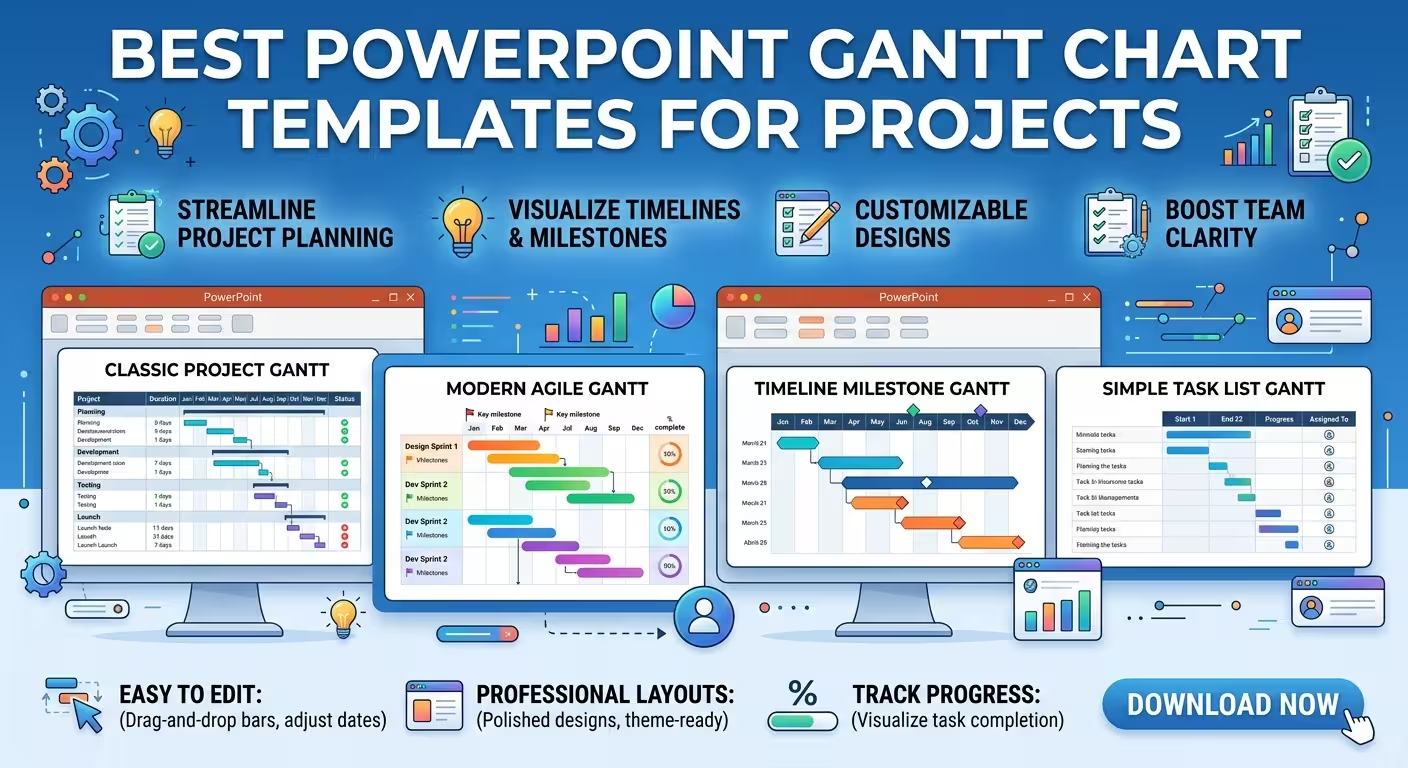
A Gantt chart can make a complicated project look obvious—or turn a perfectly reasonable schedule into an unreadable wall of bars. The difference is rarely the project itself; it is usually the template chosen for the presentation.
This guide compares the best PowerPoint Gantt chart templates on ImagineLayout by the job they need to perform: showing a detailed schedule, giving executives a fast overview, explaining dependencies, or turning a working plan into a polished presentation slide. The goal is not to find the template with the most layouts, but the one that fits the amount and type of information you actually need to show.
What makes a PowerPoint Gantt chart template useful?
A Gantt chart has a deceptively simple structure: tasks on one axis, time on the other, and horizontal bars showing duration. But once a project contains phases, milestones, dependencies, owners, progress states, and several time scales, the slide has to make choices about what deserves visual priority.
That is why a good PowerPoint Gantt chart template should be judged by more than whether it contains horizontal bars. Look at four practical questions:
- Can the timeline scale match the story? A two-week launch and a two-year transformation should not be forced into the same visual density.
- Can dependencies remain readable? Connecting every task can create more visual noise than useful information.
- Can milestones be found instantly? A major approval or launch date should not disappear among ordinary task bars.
- Can the chart survive presentation conditions? A layout that looks excellent at 100% zoom may become difficult to read on a projected screen.
ImagineLayout currently offers dedicated Gantt chart collections as well as broader project-timeline packs. The distinction matters: a project timeline can communicate sequence without showing the full scheduling logic that makes a Gantt chart useful.
1. Gantt Timeline Charts PowerPoint — best for detailed project schedules
When the presentation needs to show actual task sequencing rather than simply announce a few dates, start with a dedicated Gantt layout.
Gantt Timeline Charts PowerPoint - Fully Editable includes 18 editable layouts built around Gantt bars, dependency connectors, and milestone markers. The collection is available as PPTX and POTX and uses a 16:9 format, making it a practical starting point for standard widescreen presentations.
The important feature is not the number of slides. It is the separation between the three visual jobs. Task bars communicate duration, connectors communicate relationships, and milestone markers identify points that matter. Keeping those roles distinct prevents the common mistake of asking one visual element to communicate everything simultaneously.
This type of template is particularly useful when presenting:
- multi-phase implementation plans;
- product or software launch schedules;
- construction or infrastructure programmes;
- marketing campaigns with overlapping workstreams;
- quarterly plans where several activities run in parallel.
There is also a useful presentation-design constraint here: dependency lines should explain the schedule, not become the schedule. If the audience needs to trace dozens of relationships individually, a single slide may be the wrong communication format. Use the Gantt slide for the structure, then move detailed scheduling logic into supporting material.
2. Business Gantt PowerPoint Charts — best for management presentations
A project manager and an executive rarely need to see the same amount of information. The project manager may care about individual task durations; the executive often needs phases, milestones, major dependencies, and the point at which the project is expected to deliver.
Business Gantt PowerPoint Charts is built around that broader business context. The current collection contains 23 editable layouts and covers different timeline views, from shorter planning periods to larger multi-phase schedules.
For a management deck, the useful approach is to resist the temptation to fill the available space. Start with the decisions the audience needs to make. If the question is whether a launch date is realistic, show the phases that constrain that date. If the question is where workstreams overlap, emphasize those overlaps rather than listing every subtask.
This is where a Gantt template becomes a presentation tool rather than merely a project-management diagram. The underlying schedule can be detailed, but the slide should expose only the scheduling logic relevant to the meeting.
A practical structure is:
- major phases as the primary rows;
- milestones as visual checkpoints;
- only the dependencies that affect the decision being discussed;
- progress or status information where it changes the interpretation of the schedule.
If a slide still requires a paragraph explaining how to read it, the chart probably contains too much project-management detail for that audience.
3. Gantt Timeline PowerPoint Chart — best for compact project storytelling
Sometimes the problem is not a lack of information but a lack of room. A project update may have only one slide available for the entire schedule.
Gantt Timeline PowerPoint Chart Template offers 14 editable layouts with different time scales and multi-phase views. Its structure is useful when you need to move between a high-level Gantt overview and a more detailed view without rebuilding the visual language from scratch.
The key design decision is the time unit. Days work when the audience needs operational precision. Weeks are usually easier for short-term programmes. Months make more sense when the presentation is about a launch, transformation, construction phase, or annual initiative.
Do not choose the smallest available time unit simply because it is more precise. Precision that cannot be read from the back of a meeting room is not useful precision.
A good test is to hide the task labels temporarily and look only at the bars. Can you still see where the project accelerates, where work overlaps, and where the major gaps occur? If yes, the time scale is probably doing useful visual work. If every bar looks like an identical strip, change the scale or reduce the number of tasks.
4. Project Timeline PowerPoint Charts — when a full Gantt would be too much
Not every project presentation needs a true Gantt chart. This is an important distinction when choosing among PowerPoint templates.
A Gantt chart is valuable when duration and scheduling relationships matter. A timeline is often better when the audience mainly needs to understand sequence: phase one happens, then phase two, then the launch, then the review.
Project Timeline PowerPoint Charts contains 20 editable layouts aimed at communicating project progress and chronology. It is therefore a useful alternative when the presentation needs a visual project roadmap but does not require every task to behave like a scheduling record.
Consider using a timeline instead of a Gantt when:
- the project has only a handful of meaningful milestones;
- the audience is unfamiliar with project scheduling notation;
- the purpose is to explain the sequence rather than manage the schedule;
- the presentation is an executive or investor narrative rather than an operational review.
This distinction prevents a common design failure: using a technically correct Gantt chart to answer a question nobody in the room is asking.
How to choose the right Gantt template before editing it
Before replacing a single placeholder, write down the message the slide must communicate in one sentence. For example: “The launch depends on three overlapping workstreams finishing before the final approval.” That sentence immediately tells you that dependencies and the approval milestone matter more than displaying every individual task.
Then match the template to the communication problem:
- Detailed scheduling: choose a dedicated Gantt layout with clear dependency connectors.
- Executive project review: choose a business-oriented layout where phases and milestones dominate.
- Compact project update: use a Gantt with several time-scale options and a controlled number of rows.
- Simple chronological story: use a project timeline instead of forcing a full Gantt onto the slide.
One thing people often overlook is the relationship between the number of tasks and the number of slides. If a project has 40 tasks, the answer is not necessarily a 40-row Gantt. Split the communication by workstream, phase, or decision point. A template with multiple related layouts becomes much more useful when each slide has one clear role.
How to make a Gantt chart readable in PowerPoint
The strongest Gantt slides usually have an intentional imbalance: the important scheduling information is visually stronger than the supporting information.
For example, if the presentation is about a delayed launch, the launch milestone and the tasks immediately affecting it should dominate. Background activities can remain visible, but they should not compete with the critical story.
Be especially careful with color. Using a different color for every team may look organized while actually making the chart harder to interpret. Color is more useful when it represents a dimension the audience needs to compare—such as status, workstream, or risk—and that meaning remains consistent across the deck.
Labels deserve similar discipline. Long task names inside narrow bars create two problems at once: the bar stops looking like a duration indicator, and the text becomes too small. Put explanatory labels outside the chart when necessary, or shorten task names to the smallest wording that preserves meaning.
Finally, check the slide at the size in which it will actually be presented. A Gantt chart is unusually vulnerable to the “looks fine on my monitor” problem because it combines small text, thin connectors, and many aligned elements.
The best template is the one that preserves the schedule's hierarchy
There is no single best PowerPoint Gantt chart for every project. A detailed implementation schedule, an executive status update, and a launch roadmap may all describe the same project while requiring completely different visual structures.
The useful choice is therefore not the template with the most decoration or the largest number of slides. It is the one that makes the important scheduling relationship obvious with the fewest competing elements.
Start with the decision the audience needs to make, identify the phases, dependencies, and milestones that affect that decision, and only then choose the Gantt layout. Once that hierarchy is right, an editable template can remove a large amount of repetitive slide construction without taking control away from the presenter.
Comments (0)