 Click to zoom
Pyramids and Triangles Keynote Charts Template
| Format | .pptx |
| Slides | 17 unique layouts |
| Aspect ratio | 16:9 |
| Compatibility | PowerPoint |
| Animated | No |
| Language | English |
| License | Commercial |
| File size | — |
| Version | v1.0 |
| Last updated | September 2026 |
What's inside
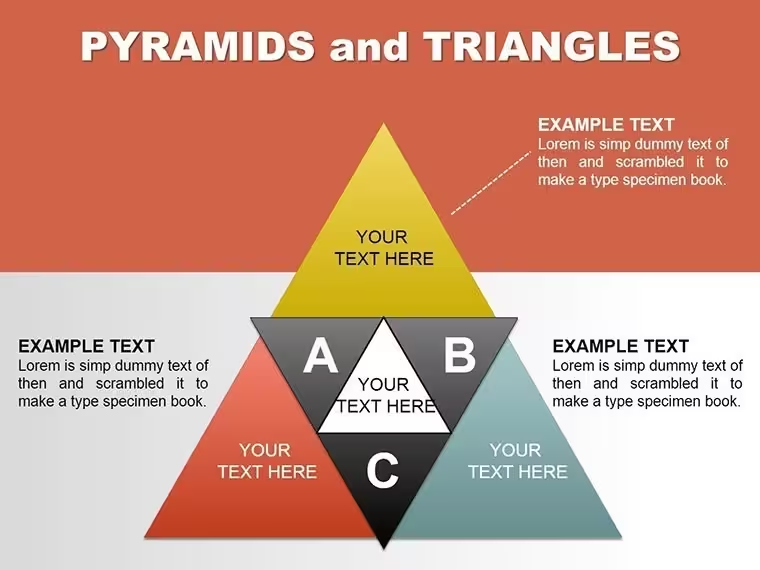
Layered Pyramids and Directional Triangles for Keynote
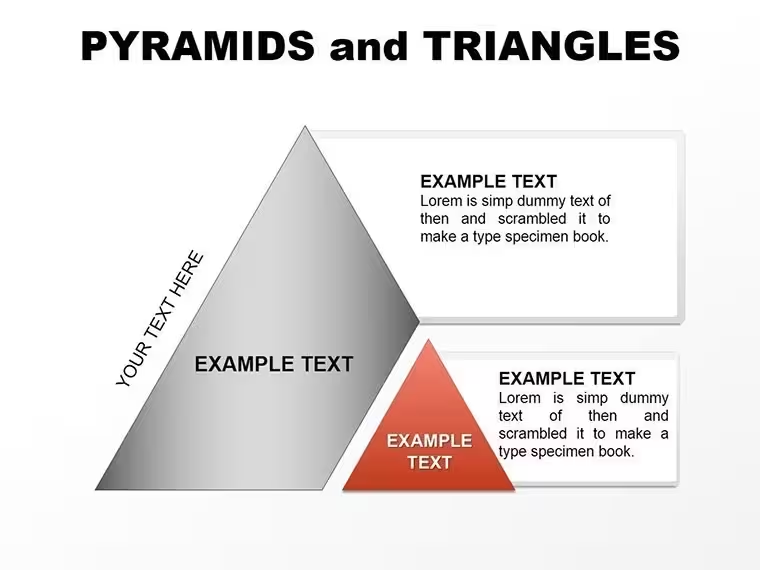
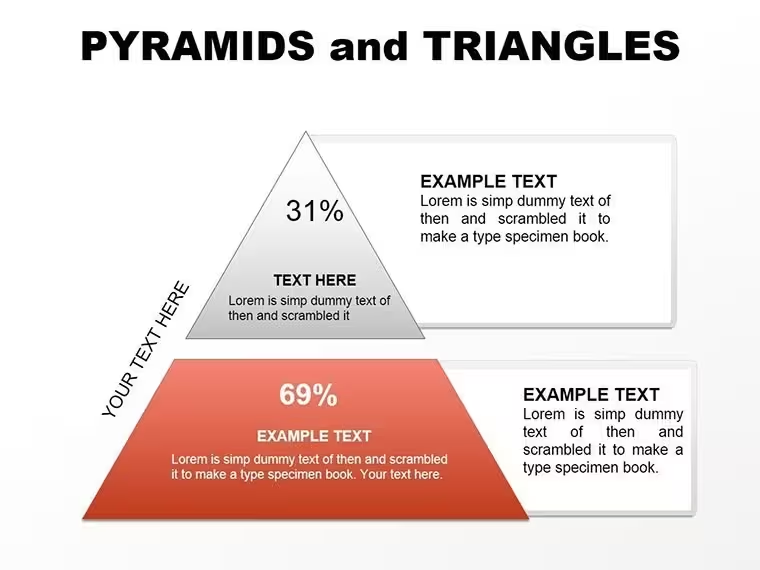
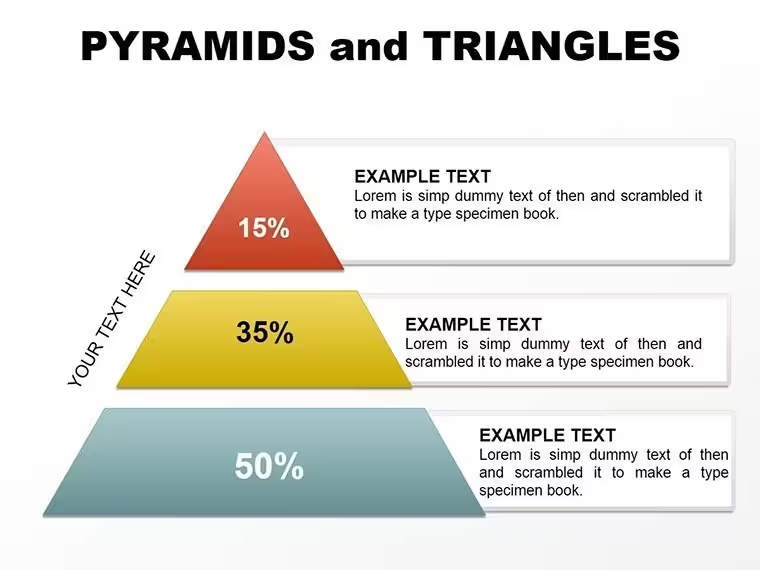
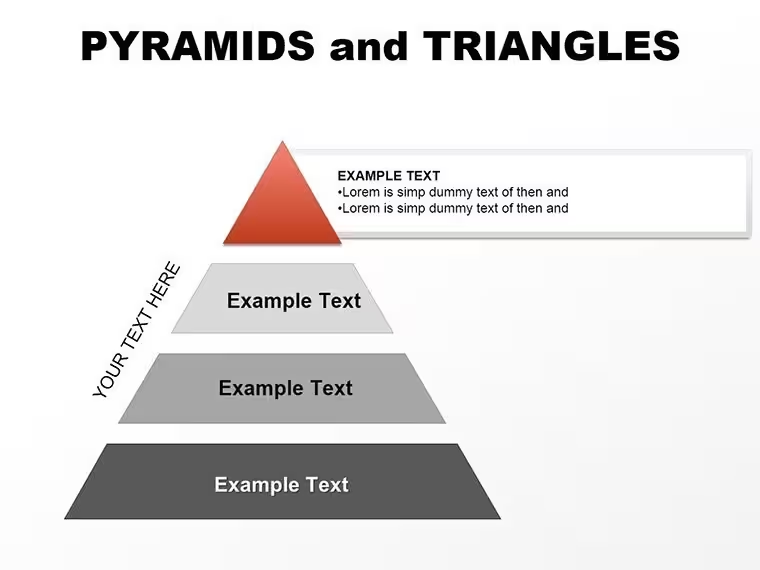
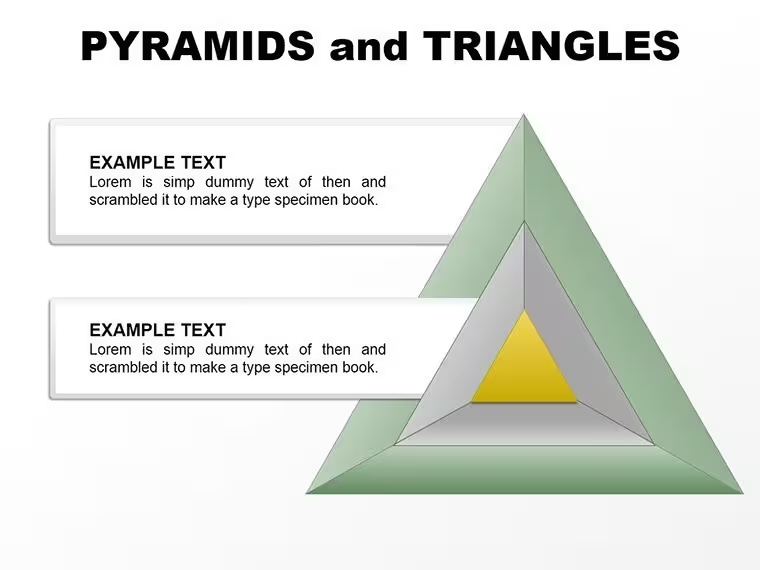
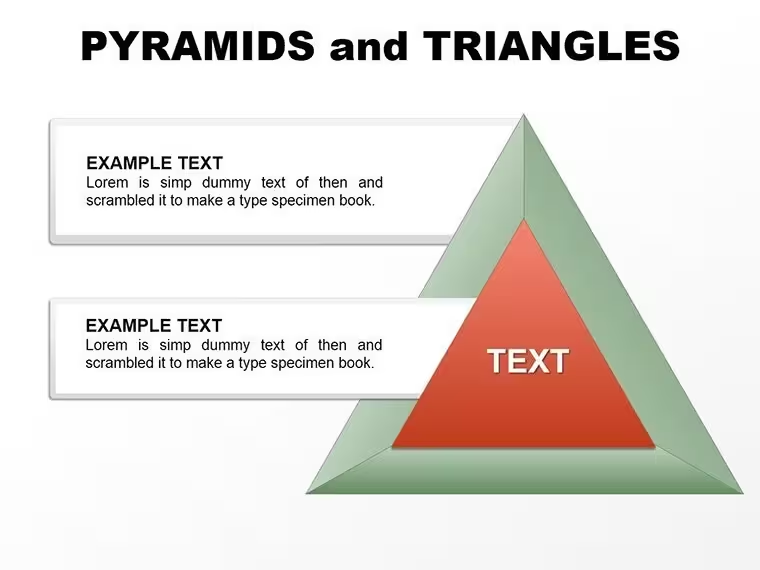
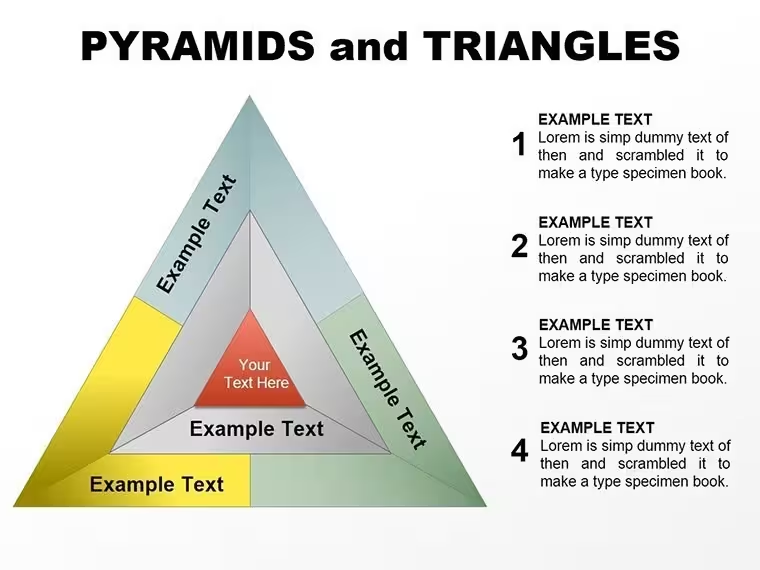
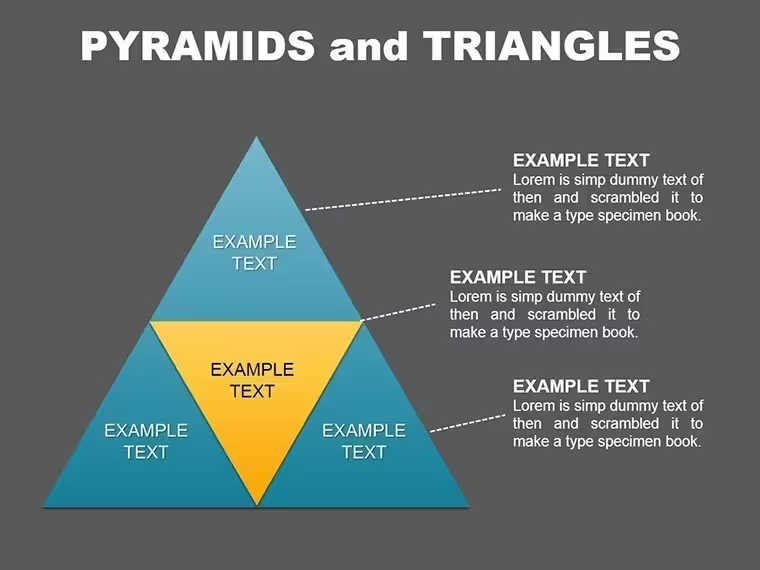
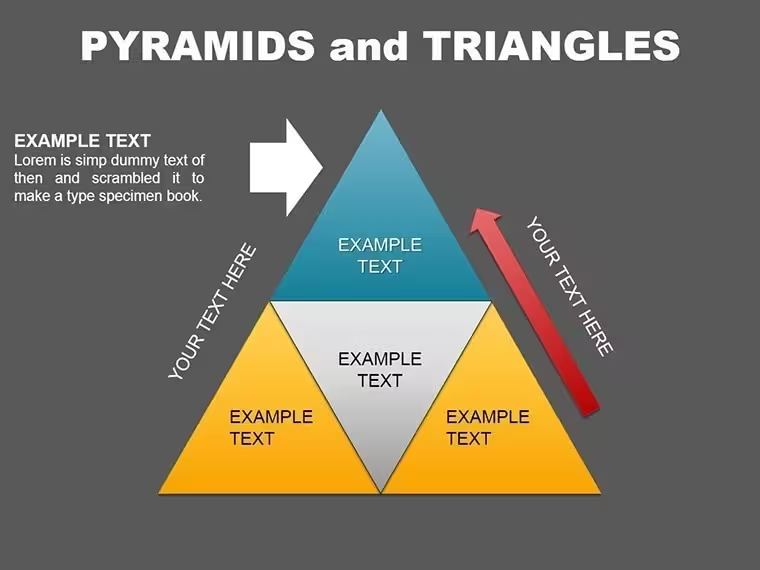
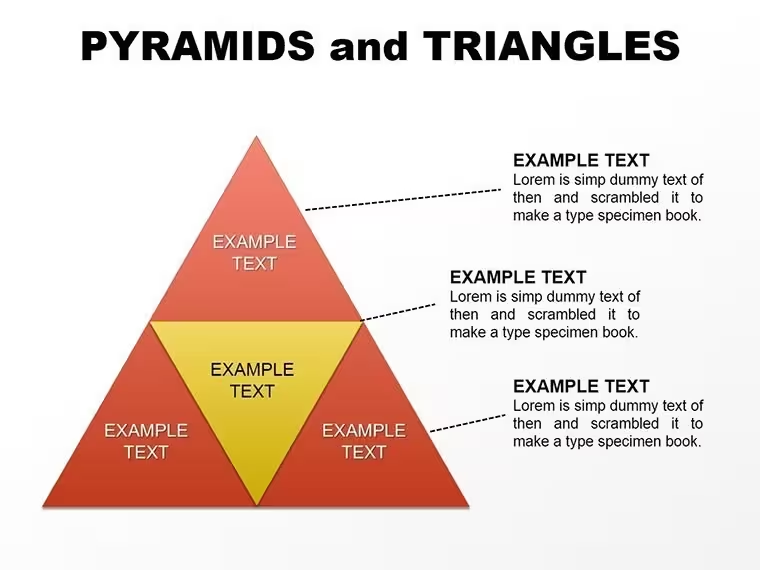
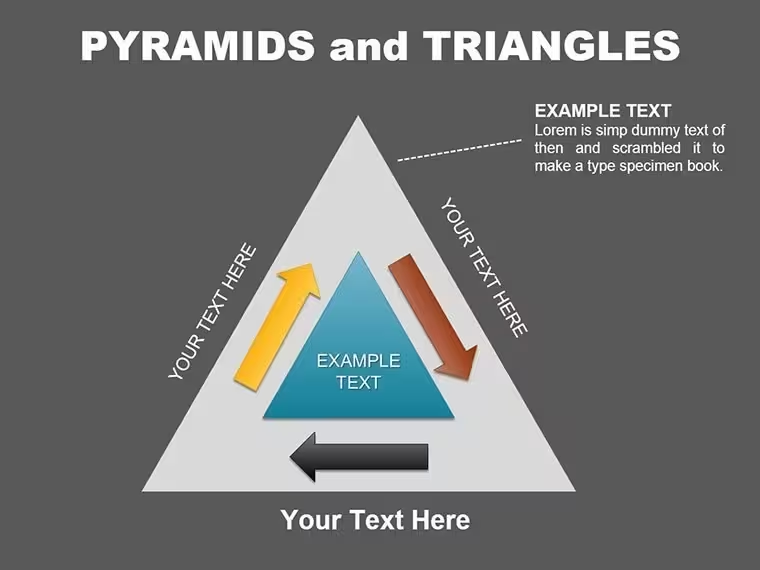
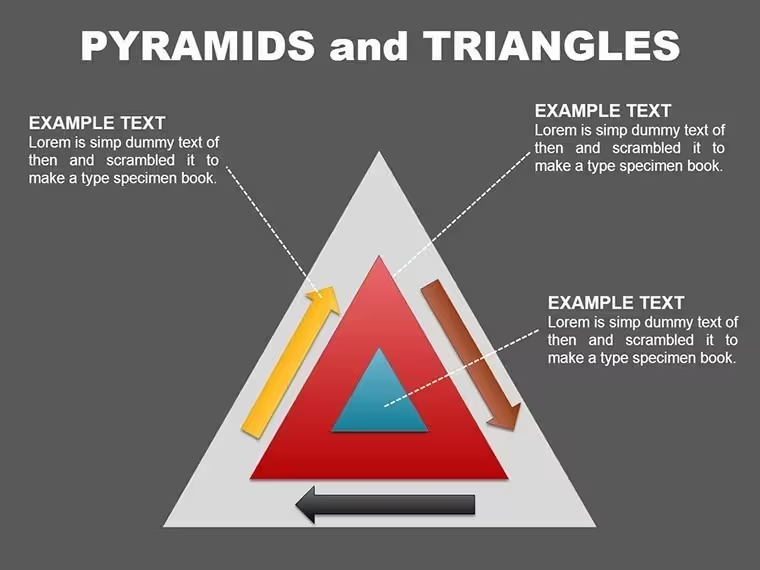
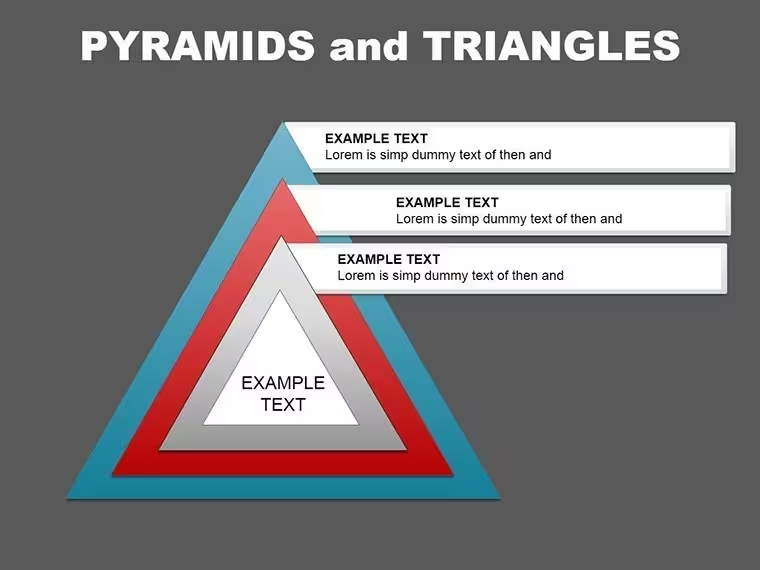
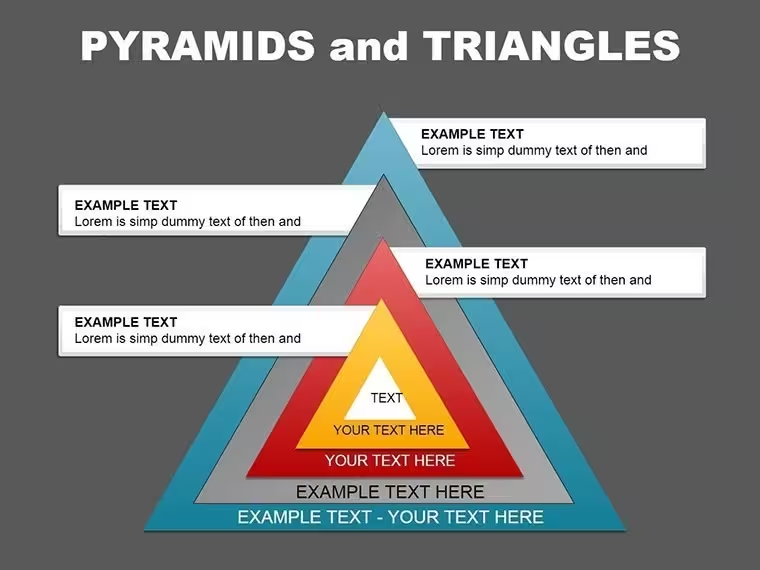
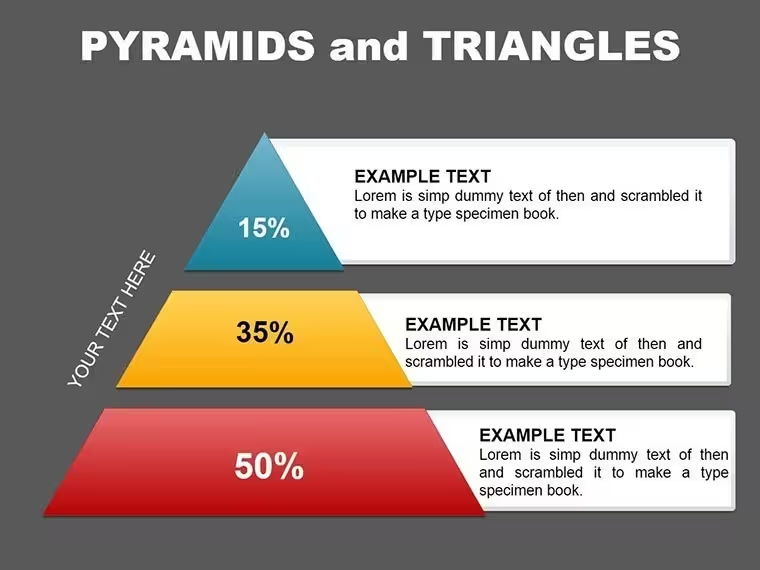
This set pairs multi-level pyramids with directional triangles across 17 slides in the Keynote Charts collection, all in 16:9 and listed as unique layouts. The pyramids suit ideas that stack, such as an org structure with leadership at the apex and support roles at the base. The triangles suit ideas that point somewhere, such as a step-by-step progression of milestones.
What You Can Edit
- Text in every pyramid level and triangle element
- Fill colours and gradients on individual layers
- Size of each element
- Layer count: segments can be added or removed without rebuilding the chart
Best Suited For
Picture a reorganisation proposal where the executive team sits at the top and each layer below names a tier of roles, or a growth plan whose stages widen toward the base. Both are the kind of layered concept this set was built around. The licence covers internal and client presentations, lets you modify the slides freely and has no cap on projects; resale, redistribution and reuse inside another template product are not allowed. Future updates to this product are free, and a 14-day refund applies if the file doesn't open or doesn't match the previews. If you want a related look, the 3D Pyramid Keynote Charts set takes the same layered idea into three dimensions.
Good to Know
This is not a Gantt chart tool. For live, date-driven scheduling, the page points to dedicated project software such as MS Project or Smartsheet.
Good for
- Project roadmaps and sprint plans
- Product launch timelines
- Quarterly or annual review decks
- Company history and milestone summaries
Licence
reviews
The area charts are decent for showing volume over time.
Used the multi-line chart for three product lines and it was clear.
Wish the tooltips were better but it's just a template.
Fine for a quick internal deck but not investor-ready.
The data labels didn't overlap which I appreciated.
FAQ
Will it work in Google Slides?
Are fonts embedded?
Can I use this for client work?
What's the refund policy?
Do you update the template after purchase?
Similar templates
See all Keynote Charts →


All 17 slides