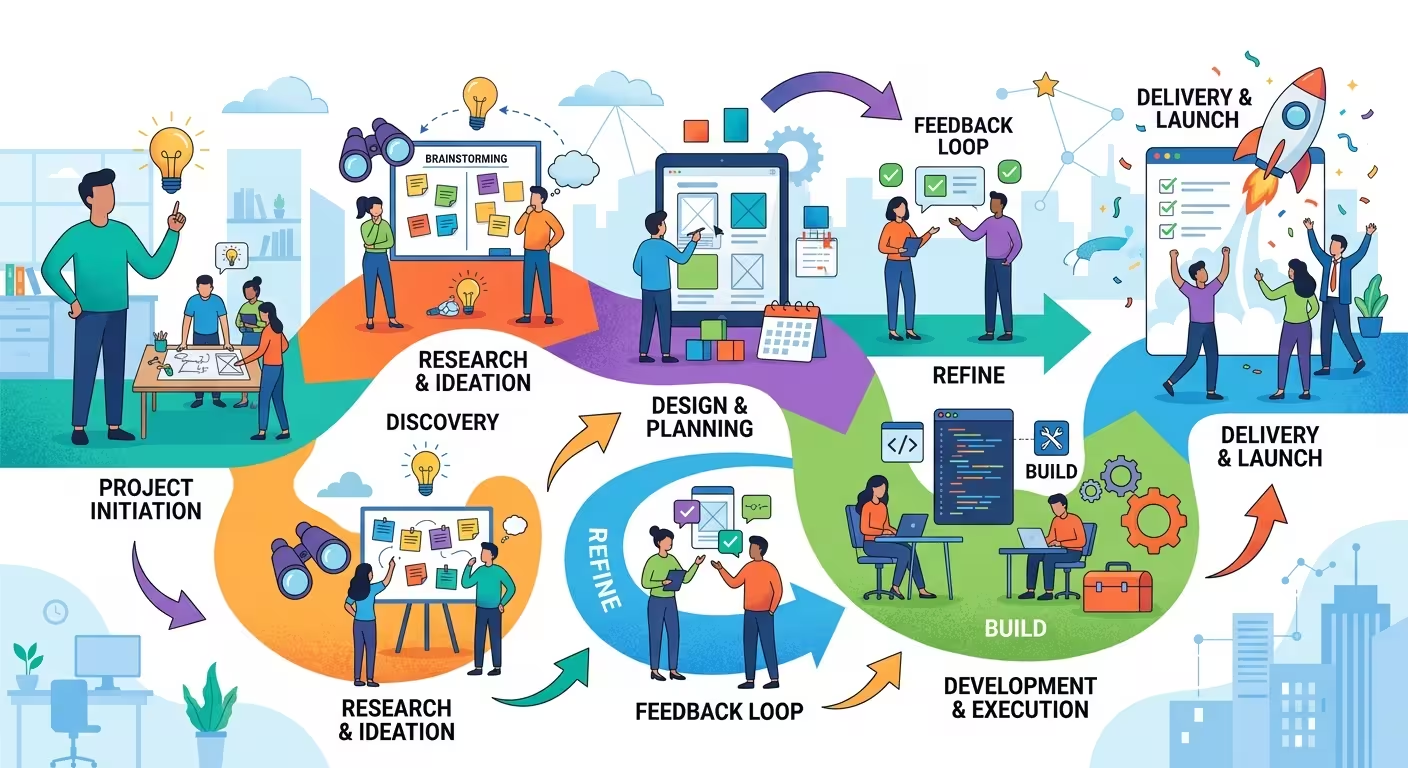
Open a deck at random and you'll usually find one slide where the presenter's energy visibly drops: the process slide. Five or six boxes, some arrows, maybe a color gradient going from light to dark to suggest progress. The presenter reads it left to right, the room reads ahead of them, and by box four everyone's already checking their phone. The process itself might be genuinely well thought out. The slide just doesn't make anyone believe that.
The strange part is that process slides are usually the most factually accurate slide in the whole deck — no invented numbers, no aspirational claims, just "this happens, then this happens." So why do they read as the dullest ones? In my experience, it's because they're built as documentation of a process rather than as an argument about it, and those require different shapes entirely.
The stage count problem nobody flags until it's too late
Here's a scenario I've walked into more than once: a client hands over an eleven-step operational process and asks for "one clean slide." Eleven boxes technically fit on a 16:9 canvas if you shrink the font enough. They just stop functioning as a process the moment they're on screen — the eye can't hold eleven sequential items as a sequence, so it reads as a list instead, and a list doesn't carry the feeling of movement that a process is supposed to convey.
A useful ceiling, in practice: once you're past six or seven stages on a single slide, the audience stops tracking order and starts scanning for whichever box looks most important. If the real process has more steps than that, the fix usually isn't a smaller font — it's grouping. Combine the eleven granular steps into three or four phases, put the detail in speaker notes or an appendix slide, and let the visible slide carry the shape of the process rather than its full inventory.
Linear arrows quietly lie about what actually happened
A left-to-right arrow chain implies something specific: that step two only starts once step one is fully finished, in that exact order, every time. Most real workflows don't behave that way — stages overlap, loop back for revision, or run in parallel. When a process slide forces a genuinely iterative workflow into a straight line because that's the default template shape, it's not simplifying the process, it's misrepresenting it, and someone in the room who actually runs that process will notice.
This is where the shape you choose should be doing argumentative work, not decorative work. A process with a feedback loop (design review, revise, re-review) reads honestly as a cycle, not a line with an extra box at the end labeled "revisions." A process with two tracks running at once — say, procurement and engineering moving in parallel before they converge — needs a layout with actual parallel lanes, not two sequences stacked and hoping the audience infers simultaneity. Swimlane diagrams exist for exactly this reason: they let you show who owns which stage without collapsing everything into one flat sequence.
Why the fully-built version usually beats the animated reveal
There's a common piece of advice to "build the process slide progressively," revealing one stage per click so the audience isn't overwhelmed. That works when you're walking a live audience through something they've never seen — a first pitch, a new methodology. It works against you when the audience already has some familiarity with the process and wants to see the whole shape up front, because forcing them to wait for stage six before they can judge whether the process makes sense reads as padding, not pacing.
The distinction I actually use: progressive build for persuasion, full reveal for reference. If the slide's job is to convince someone a new process is better than the old one, animate it — the reveal is part of the argument. If the slide's job is to document a process for people who'll refer back to it in a follow-up meeting, show it complete from the first click. Sending someone a recap deck full of half-built animated sequences that only made sense live is one of the more common ways a good presentation becomes a useless document a week later.
Where the time actually goes, and why templates aren't cheating
According to a large-scale enterprise survey on PowerPoint usage published by the software vendor empower, roughly 37% of total time spent working in PowerPoint goes into formatting rather than content — adjusting colors, aligning shapes, fixing fonts — with chart and diagram construction called out specifically as one of the biggest time sinks. That tracks with what I see in practice: teams with a genuinely strong process to communicate lose the argument on the slide because they spent their prep time nudging arrow endpoints instead of deciding what the shape should actually say about the process.
This is the case for starting from a diagram type that already matches your process's real structure — cyclical, parallel, branching, sequential — instead of a blank canvas. A process diagram template built specifically for branching or handoff-heavy workflows saves the hours that would otherwise go into manually routing connectors, and a timeline template already has the spacing logic worked out for date-based sequences. Starting there isn't a shortcut around design thinking — it just moves your time toward the decision that actually matters, which is choosing the right shape for the process you have.
Color should mark status, not just decorate stages
One thing people overlook: on a lot of process slides, every box gets its own color simply because five colors look more "designed" than one. That's backwards for a process specifically, because a process slide's most useful job — beyond showing sequence — is showing where things stand right now. Reserve color for status: one shade for completed stages, one for in-progress, one for upcoming, and let the shape (not the color) carry the difference between stages that are just different, not different in kind.
I wouldn't recommend applying a full brand gradient across a process chain unless the stages genuinely represent an ascending value — say, a maturity model or a funnel narrowing toward conversion. For a neutral operational process, a gradient implies stage six is somehow "more" than stage one, which usually isn't the point you're making.
Match the diagram family to what the process actually does
Before opening a template library, it's worth naming what kind of process you're actually showing, because the families aren't interchangeable:
- Sequential, one path, no repeats — a straight arrow chain or a numbered step diagram.
- Repeats on a schedule (monthly review, product lifecycle) — a cycle or circular chart, which visually implies return rather than an endpoint.
- Multiple teams contributing to different stages — a swimlane layout that separates ownership by row.
- Narrowing toward a single outcome (leads to customers, applicants to hires) — a funnel, which is the one shape where a shrinking visual width is actually accurate rather than decorative.
- Decision-dependent, branches based on conditions — a flowchart with real diamond decision points, not boxes pretending to be decisions.
Picking wrong here is subtler than picking an ugly template. A cyclical process forced into a straight line reads as finished when it isn't; a branching process forced into a straight line hides the decision points that actually determine outcomes — and those are usually the parts of the process someone in the room most needs to understand.
The next process slide you build, try describing the process out loud in one sentence before opening any software — "it repeats every quarter," "three teams work on it at once," "it branches depending on budget approval." Whatever verb shows up in that sentence — repeats, splits, converges, branches — is usually a better guide to the diagram shape than whatever layout happens to be open in your last template.
Comments (0)