The problem with most org charts is not that they are difficult to draw. It is that people often choose the diagram before deciding what the audience actually needs to understand.
For a simple company hierarchy, a conventional tree may be exactly right. For a matrix team, it can become misleading. For a leadership introduction, a chart overloaded with reporting lines can hide the people you actually want the audience to remember. This guide compares the best PowerPoint org chart templates by what they need to communicate, with examples from the current ImagineLayout library.
The Best Org Chart Template Is the One That Matches the Structure
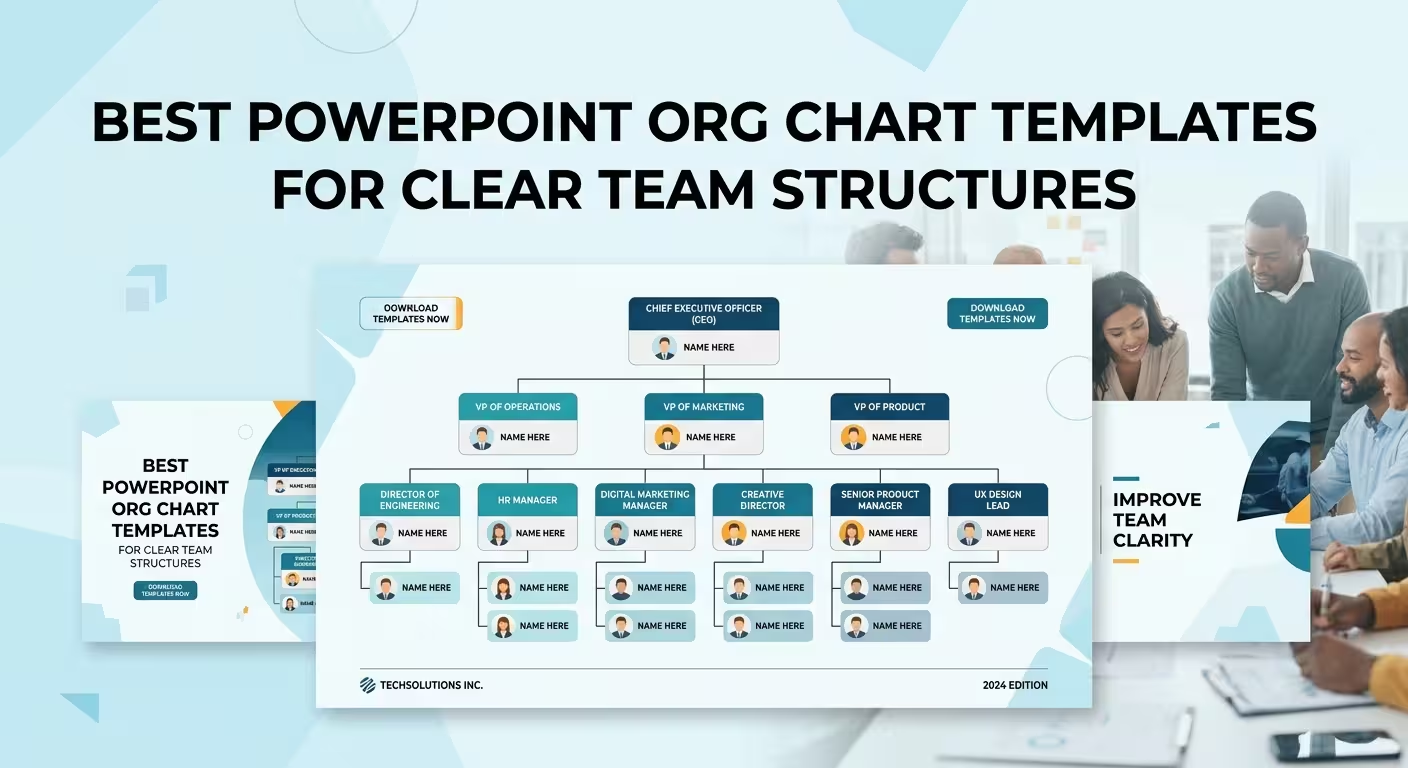
Imagine a slide showing a CEO at the top, five department heads underneath, and several employees below each department. A traditional vertical hierarchy works because the visual question is simple: who reports to whom?
Now change the scenario. The same people work across product, engineering, and regional teams, with some employees answering to both a functional manager and a project lead. Keeping the same tree structure does not merely make the slide crowded. It can imply a reporting relationship that does not actually exist.
That is the first selection rule: choose the diagram according to the relationship you need the audience to see.
- Hierarchy: use when authority and reporting lines are the main message.
- Functional structure: use when departments and areas of responsibility matter more than individual employees.
- Matrix: use when people or teams have more than one meaningful relationship.
- Project-team structure: use when the audience needs to understand who contributes to a specific initiative.
- Leadership or profile layout: use when introducing people is more important than explaining the complete reporting system.
PowerPoint org-chart libraries commonly offer several of these structures because no single diagram works equally well for every organization.
1. Hierarchical Org Chart Templates — Best for Clear Reporting Lines
If the presentation needs to answer one question quickly — who reports to whom? — start with a conventional hierarchy.
This is the safest structure for an executive overview, company introduction, onboarding presentation, or organizational change announcement where the chain of responsibility is itself the information.
ImagineLayout's Free Level Org PowerPoint Charts Template is useful when you need a compact starting point. The current page lists six editable 16:9 layouts in PPTX format, making it better suited to a focused diagram than to a large organizational-design presentation.
For a larger set of variations, the Company Organization Charts - Editable PPTX contains 18 layouts and focuses specifically on company structures, roles, growth paths, boxes, and adjustable reporting connectors.
Design decision to make: decide how many levels the audience genuinely needs. A five-level hierarchy may be accurate, but accuracy alone does not make it useful. If the meeting concerns the executive structure, showing every individual contributor can turn an organizational overview into a directory.
2. Company Org Chart Templates — When Departments Matter
A company-wide chart often becomes unreadable because every department is given equal visual treatment. The result technically represents the organization but gives the audience no clue where to look first.
A better approach is to establish the structural level first, then decide whether employee-level detail belongs on the same slide.
The current ImagineLayout Organizational PowerPoint Charts Template provides 42 editable layouts and is positioned around hierarchies, roles, and organizational relationships. That makes a larger chart library useful when one presentation needs several related views rather than a single company tree.
This distinction matters in practice. You might use one slide for the complete structure, another for the leadership team, and a third for a department that requires more explanation. The audience gets progressive detail instead of trying to read the entire company from one oversized diagram.
3. Project and Cross-Functional Org Charts — When a Tree Starts Lying
Some teams simply do not have a clean top-to-bottom structure.
A product launch, consulting engagement, transformation program, or cross-functional initiative can involve people from several departments without changing their formal reporting relationships. If you draw those relationships as a normal hierarchy, the slide may suggest that the project manager is the functional manager, or that one department controls another.
In this situation, separate formal reporting from project participation.
A useful presentation can show:
- the functional manager as the primary vertical relationship;
- the project or workstream relationship as a secondary connection;
- departments as visual groups rather than additional management levels;
- only the roles relevant to the project instead of reproducing the entire company.
This is where editable connectors matter more than decorative styling. The ability to reposition boxes without rebuilding the entire diagram is valuable when the structure contains multiple relationships.
ImagineLayout's Org Structure PowerPoint Charts - Editable PPTX contains 11 editable organizational layouts with adjustable boxes, text placeholders, color themes, and reporting connectors.
The practical test: if the audience can interpret a connector as a reporting line, do not use that connector merely to show collaboration. Different relationships need visibly different visual rules.
4. Org Chart Templates With Profiles — When the People Are the Message
There is a subtle difference between showing an organization and introducing an organization.
If the slide is being used for onboarding, a leadership introduction, an investor presentation, or a team overview, names alone may not be enough. But adding a photograph, title, department, responsibilities, and biography to every box can destroy the hierarchy.
In that case, use the org chart as an index rather than the complete presentation.
The first slide can establish the structure. A following slide can expand one department or leadership group with profiles. This preserves the organizational relationship while giving important people enough room to be understood.
That is one reason modern org-chart template collections often include both tree diagrams and profile-oriented layouts rather than forcing every piece of information into the same box. Current PowerPoint org-chart libraries use variations with employee profiles, avatars, and role details for exactly this purpose.
5. Matrix and Circular Layouts — Use Them Only When the Relationship Requires Them
Matrix and circular org charts can look more sophisticated than a conventional hierarchy, but visual novelty is not a reason to use them.
A matrix makes sense when two dimensions are genuinely important — for example, a functional department combined with project responsibility. A circular structure can work when the goal is to emphasize a central leadership or organizational concept rather than communicate a strict vertical chain.
The danger is that unusual geometry can make a familiar relationship harder to decode. If everyone ultimately needs to ask, “Who is this person's manager?”, a decorative radial diagram may be working against the question.
Competing PowerPoint template libraries currently distinguish hierarchical, matrix, flat, circular, and functional organizational structures, which reflects a useful principle: the visual form should follow the organizational model rather than the other way around.
What to Look for Before Choosing an Org Chart Template
Template previews can be deceptive. A chart may look excellent with six placeholder boxes and become unusable as soon as real names and job titles are inserted.
Before choosing a PowerPoint org chart, check these structural details:
- Connector behavior: can reporting lines be moved without rebuilding the diagram?
- Text capacity: can real job titles fit without reducing the font to an unreadable size?
- Hierarchy depth: does the layout remain understandable at the number of levels your organization actually has?
- Branch width: what happens when one manager has substantially more direct reports than another?
- Relationship types: can the slide distinguish reporting, collaboration, and project responsibility?
- Expansion: can one department be duplicated or extended without destroying alignment?
- Presentation scale: does the chart still work when projected in a meeting rather than viewed as a full-size template preview?
The last point is frequently underestimated. A template can look spacious on a product page and become dense when viewed from the back of a conference room. Org charts are diagrams first and typography second: if the audience cannot trace the structure quickly, adding more information rarely fixes the problem.
Which PowerPoint Org Chart Template Should You Choose?
Use the simplest structure that accurately represents the relationship you need to explain.
- Need a straightforward company hierarchy? Start with a hierarchical org chart.
- Need a compact, free starting point? The six-layout Free Level Org PowerPoint Charts Template is a practical option.
- Need several company-structure variations? The 18-layout Company Organization Charts collection provides more room to adapt the presentation.
- Need a broad organizational-chart toolkit? The 42-layout Organizational PowerPoint Charts collection gives you more variations for different structural views.
- Need to explain a project team rather than formal management? Use a structure that separates project relationships from reporting lines.
- Need to introduce executives or employees? Combine an overview hierarchy with dedicated profile layouts instead of packing biographies into the main tree.
- Need to show dual relationships? Consider a matrix layout, but only when both dimensions are essential to the audience's understanding.
The strongest org-chart slide is rarely the one with the most visual effects or the most information. It is the one where the audience can identify the relationship being shown, trace it without hesitation, and understand why that relationship matters to the presentation.
That is also the real advantage of using a template: not simply avoiding the work of drawing boxes, but starting from a structure that has already solved the difficult part — how those boxes and relationships should behave on a presentation slide.
Comments (0)