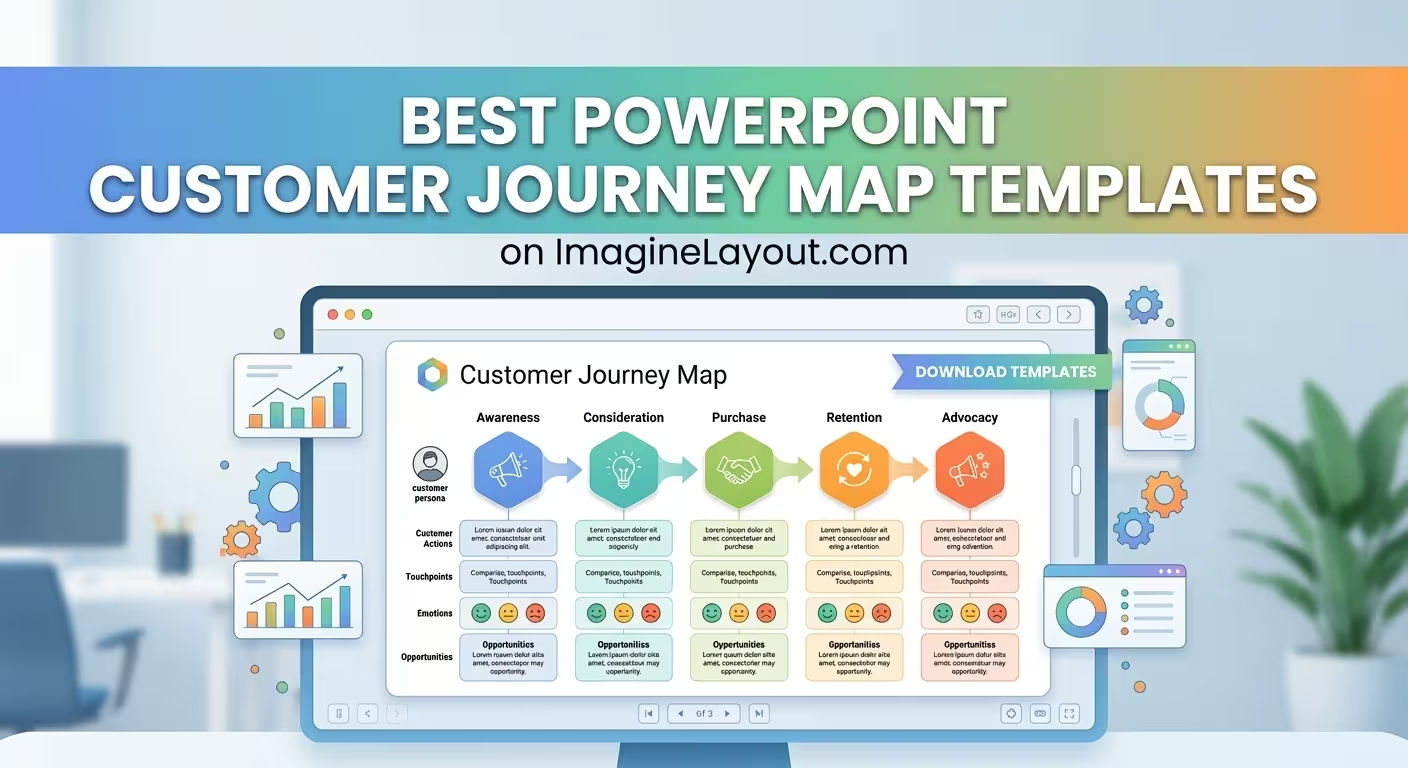
A customer journey map can look perfectly organized and still tell the wrong story. The problem is usually not the colors, icons, or typography — it is choosing a diagram that treats a customer relationship as something it is not.
That matters when you are preparing a UX workshop, customer experience review, sales presentation, or strategy deck. A linear journey works well for a sequence of decisions, while a funnel emphasizes conversion and a cycle makes more sense when the customer repeatedly returns to the business. The best PowerPoint customer journey map templates are therefore not necessarily the most elaborate ones; they are the ones whose structure matches the question your presentation needs to answer.
Start with the journey you actually need to explain
Before opening PowerPoint, decide what kind of journey is being mapped. This sounds obvious, but it is where many otherwise polished presentations go wrong.
If the audience needs to understand what happens from first contact to purchase, a staged or funnel-based visual may be appropriate. If the presentation is about what a customer experiences while interacting with support, the journey may loop back through feedback and follow-up. If the goal is to show a broader experience across several touchpoints, a horizontal journey with parallel information layers can work better.
A useful test is to complete this sentence:
"After seeing this slide, the audience should understand how ______ changes from one stage to another."
If the blank is filled with "conversion," a funnel may be more useful than a traditional journey map. If it is "customer experience," you may need stages, touchpoints, pain points, and emotional responses. If it is "service interaction," a cyclical structure can make the recurring nature of the relationship much easier to see.
This distinction is more important than whether a template contains 10, 20, or 30 layouts. Extra slides cannot repair a visual model that does not fit the argument.
For buyer journeys, use a structure built around decisions
A buyer journey is often presented as a simple sequence: awareness, consideration, purchase, and retention. The difficulty starts when the slide needs to explain why customers move between those stages.
For that type of presentation, a template with multiple chart structures can be more useful than a decorative journey illustration. ImagineLayout's Buying Process PowerPoint Chart Template contains 22 editable layouts and is specifically structured around buying stages, including cycle charts, bar charts, and pie charts. The page describes applications ranging from sales presentations to consumer-behavior training.
The practical advantage is that you do not have to force every piece of evidence into one horizontal timeline. One slide can establish the buying stages; another can compare conversion or other stage-level metrics; another can show factors influencing a decision.
That is particularly useful when the audience already understands the basic journey. Repeating the same five-stage diagram adds little. Showing where the evidence changes between stages gives the map a reason to exist.
When the customer relationship repeats, a cycle beats a timeline
Consider a support interaction. A customer contacts the company, receives assistance, gives feedback, encounters another issue, and returns to support. A straight line can imply that the experience has a clean endpoint when it does not.
For this situation, ImagineLayout's Customer Service Cycle PowerPoint Charts uses circular and flow-based structures designed around recurring customer interactions. The template contains 12 editable widescreen layouts and is positioned for customer support, service analysis, training, and feedback-loop presentations.
The important design decision is not simply "use a circle." It is deciding whether the return path itself carries meaning. If feedback changes the next interaction, the loop communicates something a timeline cannot. If the process actually ends after purchase and there is no meaningful recurrence in the story, a cycle can become decorative rather than informative.
In a service presentation, this also gives you room to separate different kinds of information: interaction stages on the main path, customer pain points beside specific stages, and feedback or recovery actions around the loop. The audience can then see not just what happens, but where the organization has an opportunity to intervene.
Use a funnel when conversion is the real question
There is a subtle difference between a customer journey map and a conversion journey. The first asks what the customer experiences. The second often asks how many people progress from one commercial stage to another.
That distinction makes funnel templates useful for marketing and sales decks. ImagineLayout's Sales Funnel PowerPoint Template with Editable Charts provides 39 layouts and is designed around stages from awareness through purchase, with editable funnel elements for stage values and metrics.
A funnel becomes especially effective when the presentation needs to expose a narrowing point. For example, if a large audience reaches an early stage but substantially fewer people reach a later stage, the geometry itself communicates the change before the viewer reads every number.
But there is a trade-off: a funnel can make the customer experience look more linear and deterministic than it really is. Customers may revisit information, compare alternatives, pause, return through another channel, or enter the process at different points. If those behaviors are central to your argument, a funnel should be treated as a simplified conversion model rather than the complete customer journey.
For complicated journeys, separate the flow from the evidence
One of the easiest ways to ruin a journey map is to put every available detail directly onto the main path.
Imagine a journey with six stages. Under each stage you add touchpoints, customer goals, pain points, internal actions, metrics, quotes, icons, and recommendations. Technically, everything is present. Practically, the audience has no idea which layer deserves attention.
A better approach is to decide what the main path represents and make everything else subordinate to it.
For example:
- Main path: the stages the customer moves through.
- Touchpoints: the channels or interactions associated with each stage.
- Customer evidence: pain points, needs, feedback, or behavioral observations.
- Business response: actions the organization can take.
- Metrics: only the measures that explain a meaningful change in the journey.
This is where a modular PowerPoint chart collection can outperform a single "customer journey map" slide. ImagineLayout's Flow Funnel PowerPoint Charts Template provides 14 editable layouts for process mapping and flow-based presentations.
The goal is not to cram the complete journey onto one canvas. A stronger presentation can use one slide to establish the journey, another to zoom into the problematic stage, and another to show the proposed response. The template becomes a visual system rather than a single oversized diagram.
How to choose between the main PowerPoint journey-map structures
When several templates look equally attractive, choose according to the question your audience needs answered.
- Linear journey map: best when sequence and progression are the main story.
- Buyer journey or cycle: useful when decisions, stages, and influencing factors need to be compared.
- Funnel: appropriate when the presentation focuses on movement and drop-off between commercial stages.
- Service cycle: useful when interactions repeat and feedback changes subsequent interactions.
- Flow/process diagram: better when several paths, dependencies, or operational handoffs matter.
There is no universal "best" customer journey layout. A template becomes useful when its underlying geometry matches the behavior you are trying to explain.
What to check before choosing a template
A preview can look impressive while still being awkward to use with real content. Before selecting a PowerPoint customer journey map template, inspect the structure rather than judging only the finished thumbnail.
Check how many stages fit naturally. If your journey has eight meaningful stages, a design built around four oversized milestones may force you into tiny labels or arbitrary grouping.
Check what happens to secondary information. A journey map rarely consists of stages alone. You may need touchpoints, emotions, customer goals, pain points, or internal actions. If the template has nowhere for those layers, you will probably end up rebuilding it.
Check whether the diagram can be simplified. An editable template should allow you to remove elements, not just replace text. A crowded master slide is still crowded after you change its colors.
Check whether the visual model survives across multiple slides. This is particularly important for client presentations. If one journey slide uses a horizontal path, the next uses a circular diagram, and the third suddenly becomes a funnel, the audience may spend time decoding the graphics instead of following the argument.
Finally, look for templates that solve the part of the job that is genuinely expensive to build manually: alignment, stage relationships, chart geometry, repeated components, and consistent visual treatment. You can change the wording yourself. Rebuilding a complicated diagram system from blank PowerPoint shapes is where templates earn their place.
The best customer journey map template is therefore not the one with the most visual effects or the largest slide count. It is the one that lets you express the journey without fighting the structure. Start with the behavior you need to explain, choose the visual model that matches it, and only then worry about styling the presentation around it.
Comments (0)