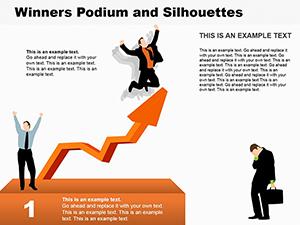
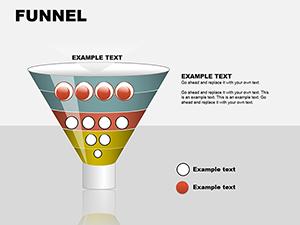
Build frameworks with graph diagram templates for PowerPoint. Essential for architects, writers, and leaders diagramming relations or sequences, these convert chaos to clarity. Decision trees, entity graphs - versatile for every vision.
Powered by PowerPoint`s shapes library, templates link intuitively. Planners map risks, writers outline plots. Pro: Auto-layout for balanced compositions.
Clean lines and smart fills inspire. In meetings or manuscripts, they organize. Survey selections and structure success.
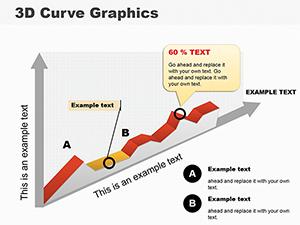
Graph diagrams model interactions, from causal chains to peer groups, surpassing silos in holistic overviews for strategy or debugging.
Advanced with bezier curves and clustering, eclipsing defaults, for publication-ready precision in proposals or patents.
Prioritize directionality and clustering. Innovate: Animated expansions for drill-downs.
Utilize connector tools for resilience. Scenario: Risk matrices as graphs, weighting threats visually.
Unique: VBA macros for auto-population. Shade paths for emphasis.
Keen? Download a diagram.
Craft coherent constructs.
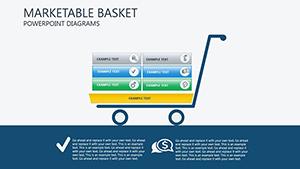
A firm graphed supply disruptions: Critical paths emerged, averting losses. Authors diagrammed character arcs, enriching drafts.
Lighthearted: Puzzle solutions as graphs. Merit: Accessibility tags included.
Diagram deliberately. Grab PowerPoint graphs now for organized brilliance.
Copyright © 2009-2026 ImagineLayout All rights reserved.