


Type: PowerPoint Diagrams template
Category: Relationship, Tables, Illustrations
Sources Available: .pptx
Product ID: PD00037
Template incl.: 15 editable slides
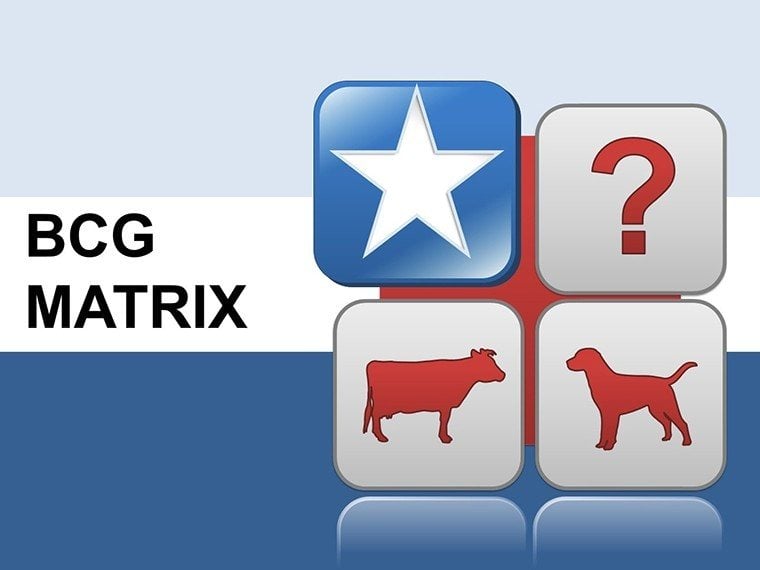
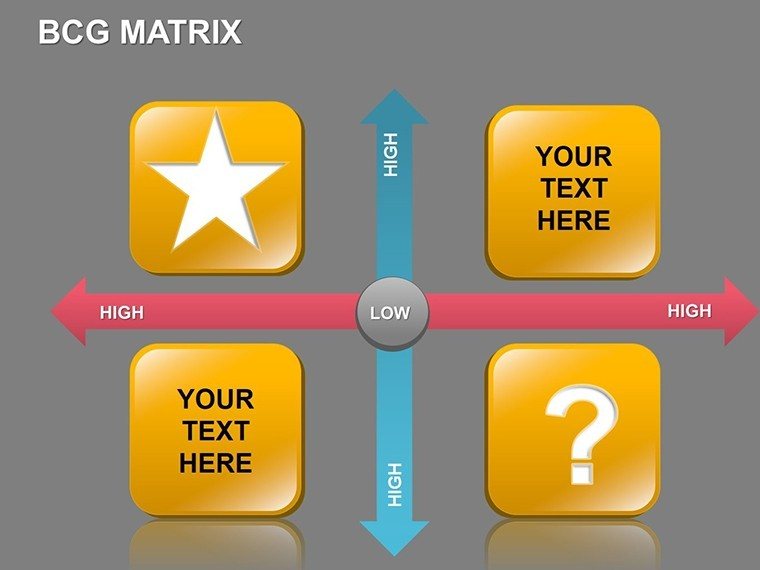
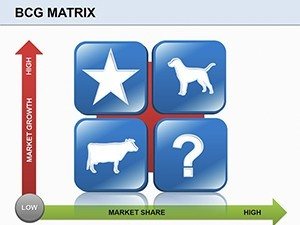
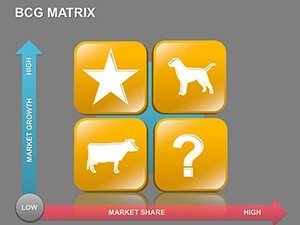
BCG Matrix PowerPoint diagrams are useful tools for firms that want to assess their product lines and strategize efficiently. The well-known Boston Consulting Group (BCG) matrix is a business framework used to comprehend a company's position in the market and help make informed decisions. Integrating BCG Matrix templates into your PowerPoint presentations lets you graphically express your company's strategic orientation and communicate complicated concepts more effectively.
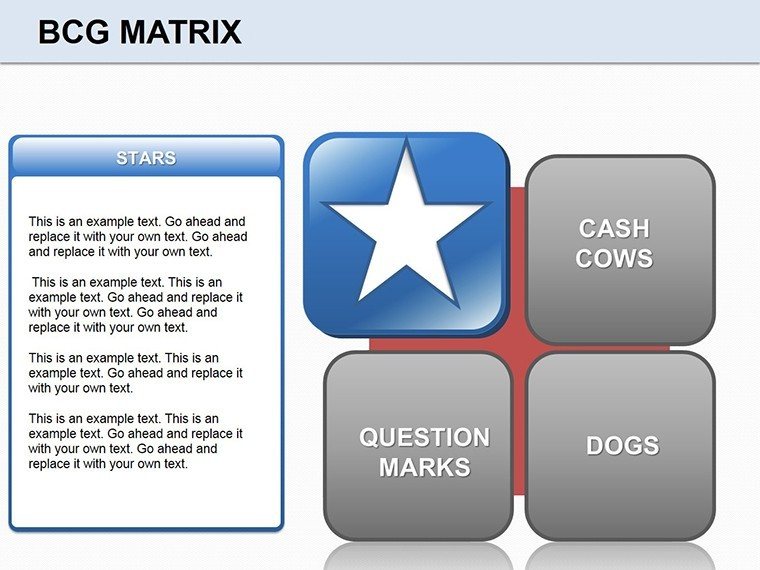
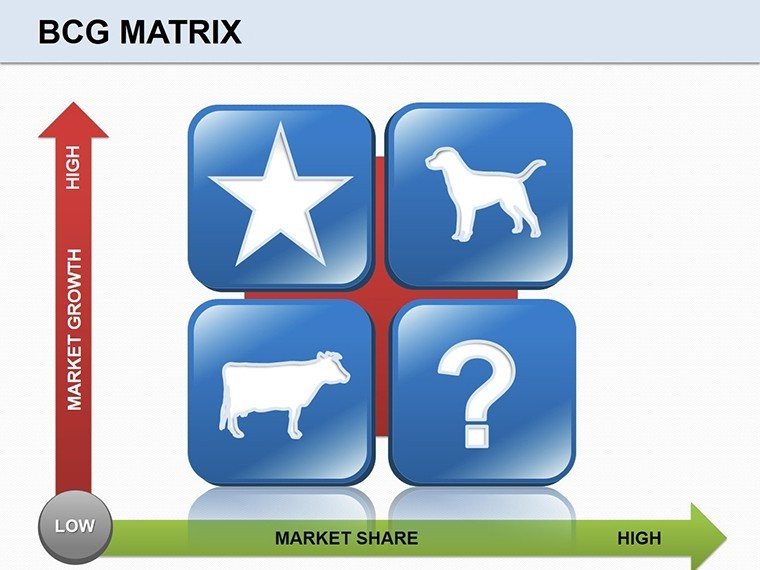
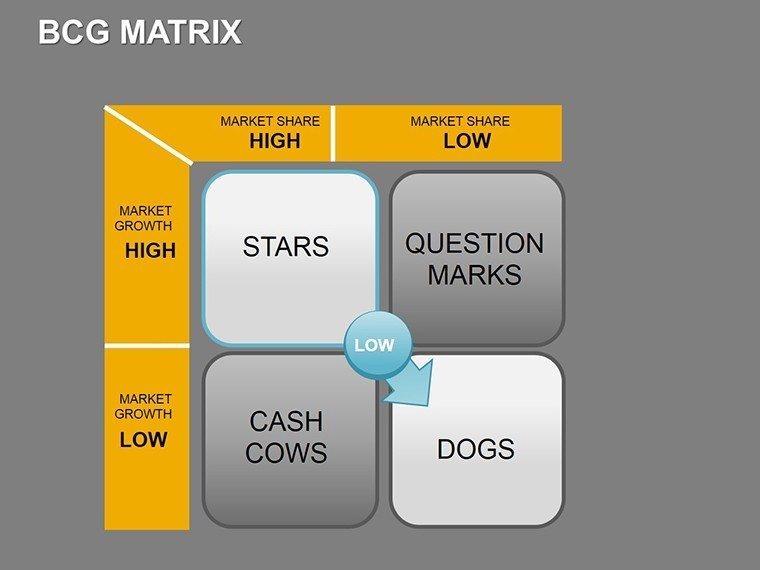
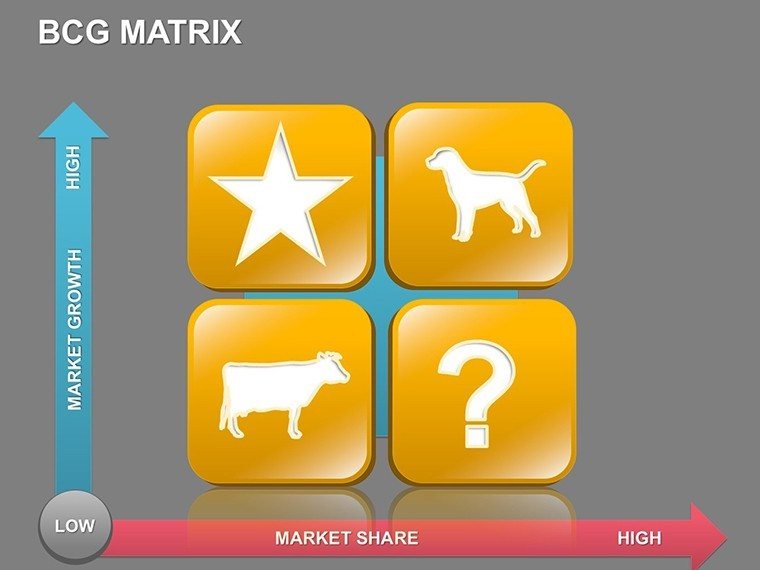
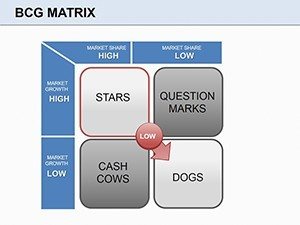
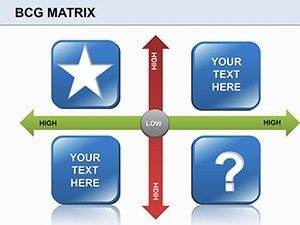
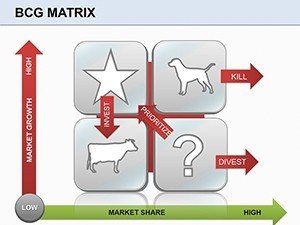
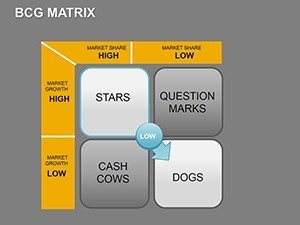
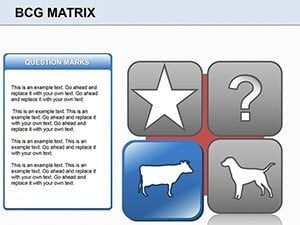
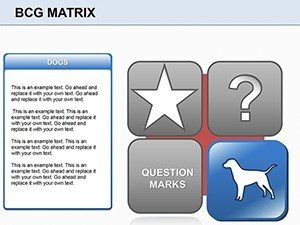
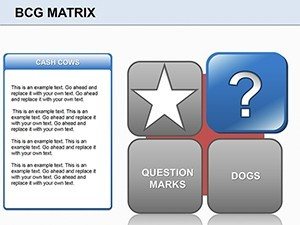
Bruce D. Henderson created the BCG Matrix, sometimes referred to as the Growth-Share Matrix, in 1970 for the Boston Consulting Group. It helps businesses to analyze their items according to market share and growth. The matrix is split into four quadrants:
1. Professional Design
Our BCG Matrix PowerPoint templates are designed by specialists to provide a clean, professional appearance. The visually appealing designs ensure your presentations stand out and leave an impression on your audience.
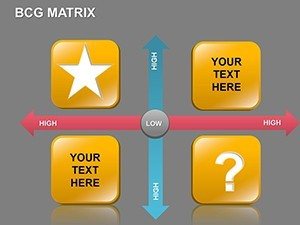
2. Customization Options
These templates are completely adjustable. You may change the colors, fonts, and layouts to match your brand's identity. Adding data and modifying the matrix to suit your unique business circumstances is simple and intuitive.
3. Versatile Applications
BCG matrix templates may be utilized in various settings, including company strategy meetings, marketing plan presentations, financial studies, and educational objectives. These diagrams are adaptable strategic planning tools for both startups and established corporations.
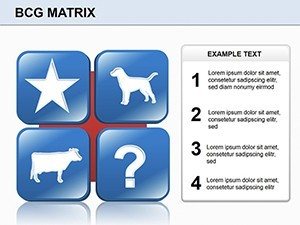
4. Clear Visual Representation
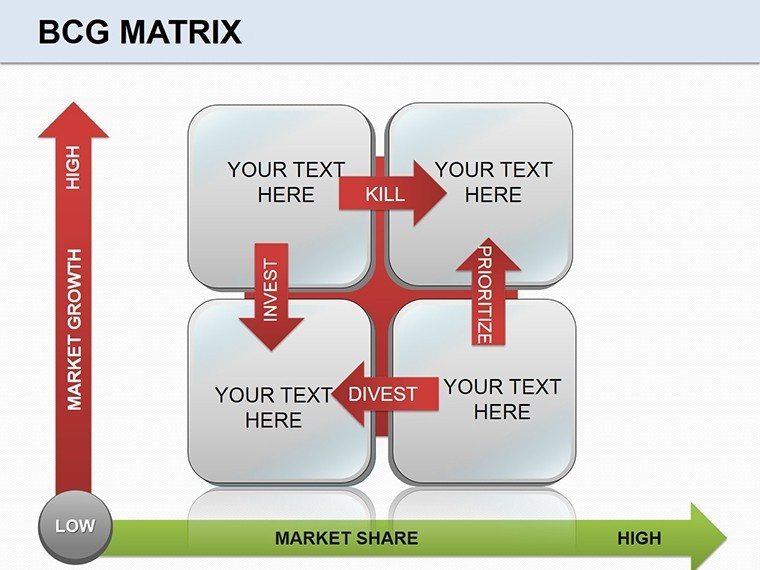
These graphs make it easier to visualize complicated facts. By putting your items in the matrix, you can quickly determine which products require further investment, which are profitable, and which should be phased out.
These diagrams are excellent for:
BCG matrix PowerPoint diagrams are essential tools for anybody working in company strategy or analysis. With their professional style, simplicity of customization, and versatility of use, these templates allow you to successfully depict and share your strategic ideas. Accept the power of the BCG matrix and make data-driven decisions to take your firm ahead.
Enhance your presentations today with our skillfully created BCG Matrix PowerPoint templates and realize the full potential of your product portfolio. Whether presenting to senior executives or teaching the next generation of business leaders, these templates will help you communicate clearly and effectively.
Copyright © 2009-2025 ImagineLayout All rights reserved.