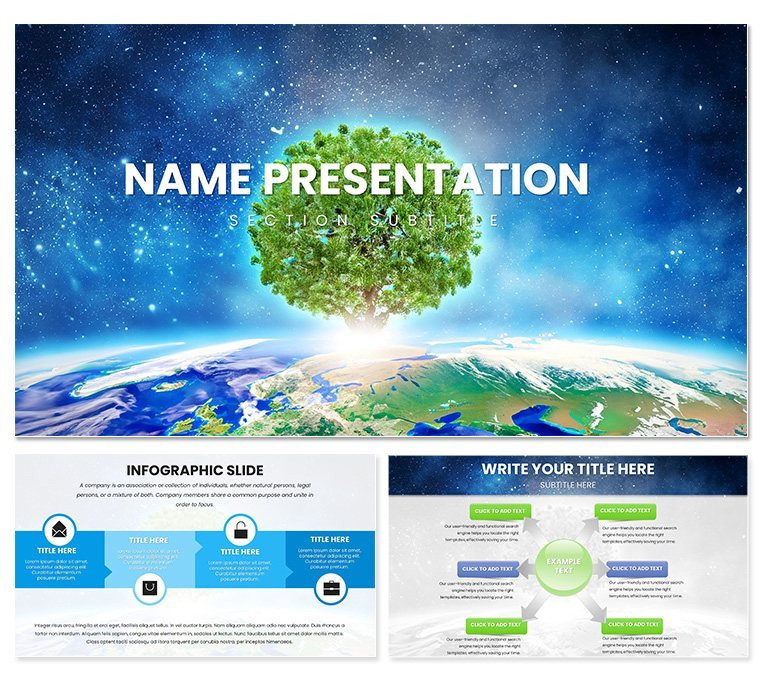
Envision a presentation where the intricate dance of life unfolds before your eyes - not in a textbook, but on vibrant slides that connect dots between species, habitats, and human impact. The Ecology Tree Planet PowerPoint Template does just that, serving as a vital resource for anyone passionate about environmental science. With 28 specialized diagrams, three master slides, three background variations, and seven color schemes inspired by earth's palettes, this template empowers educators, researchers, and sustainability advocates to craft compelling narratives on ecosystems and beyond.
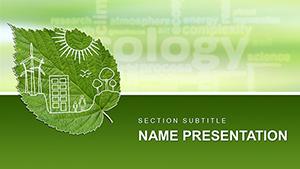
Rooted in the concept of the "tree of life," this design maps out biomes from coral reefs to boreal forests, highlighting interdependencies with clarity and beauty. It's more than slides; it's a bridge to deeper understanding, helping audiences grasp how fungi underpin soil health or how keystone species anchor entire food webs. For teachers juggling lesson plans or scientists prepping conference talks, it streamlines the shift from raw data to resonant stories, all within PowerPoint's familiar interface.
Core Features Rooted in Real-World Relevance
What sets this template apart is its focus on interactivity and accuracy. The master slides establish a clean, organic flow - think branching layouts that mimic natural hierarchies. Backgrounds evoke serene woodlands or oceanic depths, using subtle textures that enhance without distracting.
- 28 Tailored Diagrams: Network graphs for species interactions, radial trees for evolutionary branches, and layered maps for habitat distributions. Each is data-ready, with placeholders for stats on biodiversity or climate effects.
- Seven Earth-Toned Schemes: From lush greens for growth themes to stark blues for conservation alerts, ensuring visuals align with your message's tone.
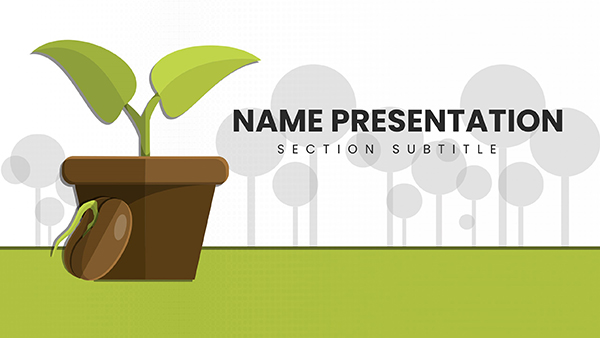
- Modular Elements: Drag-and-drop icons of flora, fauna, and microbes, scalable for any zoom level in presentations.
A highlight is the food web diagram: strands linking producers to apex predators, animatable to trace energy flows. It's ideal for illustrating disruptions, like how invasive species ripple through chains, making abstract ecology tangible.
Hands-On Customization for Deeper Impact
Adaptation is effortless in PowerPoint 2016 and up. Begin in slide master view to align fonts - opt for clean serifs like Garamond to echo natural elegance. For a diagram, insert your dataset via Excel links, then use the chart tools to recolor nodes.
- Choose a biome map slide.
- Edit labels and add hyperlinks to source studies.
- Apply animations: fade in layers from soil up to canopy.
- Preview in slideshow mode for timing tweaks.
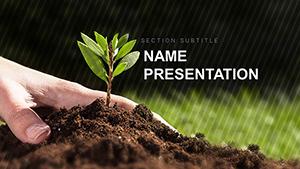
This approach not only saves prep time but enhances retention - viewers follow the "growth" visually, mirroring ecological processes. A biology professor adapted the neighborhood map for urban ecology units, plotting city green spaces against pollution data, sparking student-led discussions.
Practical Use Cases: Branching into Education and Research
In classrooms, this template shines for interactive lessons. Structure a unit on biomes with sequential slides: start with global overviews via polar area charts, then zoom into specifics with scatter plots of species density. Animations reveal connections gradually, encouraging questions like "What if this link breaks?"
Researchers presenting at symposia will appreciate the timeline for evolutionary histories - branches extending across eras, annotated with fossil evidence. It turns dense papers into digestible visuals, fostering collaborations on conservation strategies.
For environmental consultants, deploy the dependency graph in client reports: nodes as stakeholders, edges as impacts from development projects. One firm used it to model wetland restorations, with color-coded paths showing biodiversity rebounds, swaying policymakers effectively.
Building an Ecosystem Lesson Step by Step
Craft a session on ocean health. Open with a title slide: earth from space background, overlaid with a branching title tree. Agenda follows: wheel-style diagram segmenting topics from plankton to predators.
Main body? Use the web diagram for trophic levels - insert photos of marine life, animate arrows pulsing with energy transfer rates. For threats, a before-after comparison: side-by-side ecosystem maps, transitions wiping from polluted to restored states.
Wrap with action slides: radial menu of solutions, each petal linking to resources. Share via OneDrive for group annotations, extending the lesson beyond the room.
Beyond Basics: Why This Template Grows Your Impact
Standard PowerPoint builds often flatten nature's complexity; this one layers it thoughtfully, with vector graphics ensuring print-quality outputs for posters or handouts. File sizes stay lean, under 40MB, for quick loads during remote sessions.
It's also extensible - import GIS data for dynamic maps, or embed videos of field footage for immersive dives. The result? Presentations that don't just educate but inspire stewardship.
Secure the Ecology Tree Planet PowerPoint Template today for $22 and cultivate slides that nurture understanding. Watch your audiences branch out with newfound appreciation for our interconnected world.
Frequently Asked Questions
Does this template integrate with external data sources?
Yes, diagrams link easily to Excel for real-time updates on ecological metrics.
Is it suitable for high school or college levels?
Perfectly versatile - simplify for younger learners or layer details for advanced studies.
How do the color schemes adapt to themes?
Seven schemes cover diverse topics, from arid deserts to tropical rainforests.
Are animations customizable?
Fully - use PowerPoint's animation pane to sequence reveals at your pace.
What formats are available?
Download as .pptx and .potx for broad compatibility.
Can I add my own images?
Absolutely, placeholders support high-res photos of habitats and species.