


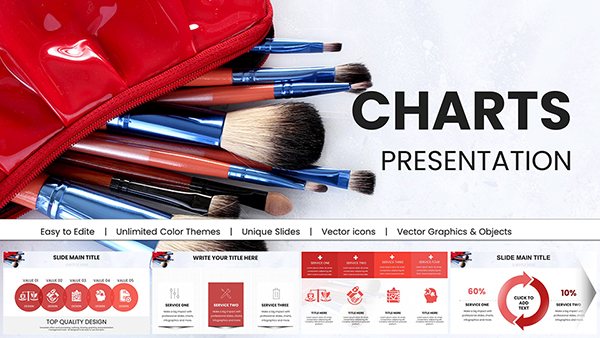
Type: Keynote Charts template
Category: Analysis, Illustrations
Sources Available: .key
Product ID: KC00971
Template incl.: 51 editable slides
Enhance your presentations to new heights! Acquire presentations enriched with Analytical Graphics Keynote Charts. Transmute data into captivating narratives today.
In the dynamic realm of contemporary commerce, the art of conveying information with precision holds paramount significance. The process of rendering data visually serves as the linchpin to impart resonance and indelibility to your presentations. With Analytical Graphics Keynote Charts, you are poised to elevate your presentations to a tier beyond.
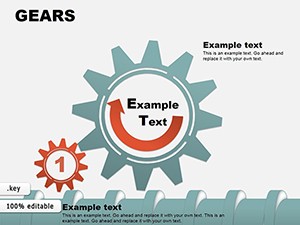
Metamorphose Data into Narratives:
Our graphical representations transcend the realm of mere visual aids; they emerge as veritable raconteurs. Whether the discourse centers around divulging sales statistics, delineating market oscillations, or elucidating financial metrics, our charts breathe vitality into your numerical encapsulations, thereby ensnaring the rapt attention and enlightenment of your audience.
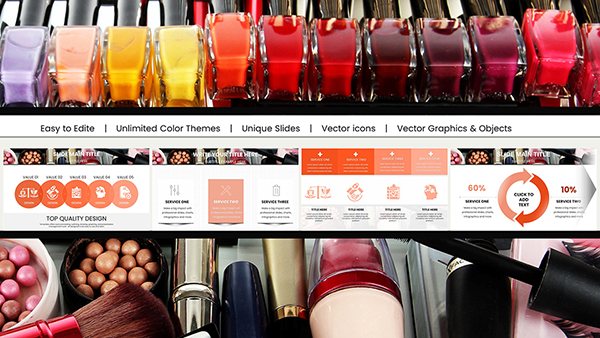
Ubiquitous Customization:
We apprehend that the universality of 'one size fits all' is a specious assumption. Ergo, our charts embody an eminently malleable nature. They may be tailored to conform harmoniously to your brand's chromatic palette, stylistic preferences, and the stipulated prerequisites of your specific dataset. With charts of this ilk at your disposal, you are poised to regale your clientele and peers with visual aids that appear to have been meticulously tailored to the unique tenets of your presentation.
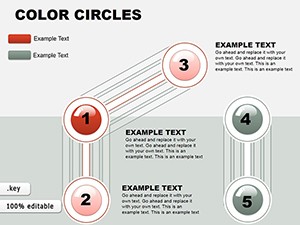
Unleashed for the Cognoscenti:
Analytical Graphics Keynote Charts are a conceptualization forged in response to the multifarious exigencies of professionals from a gamut of industries. Whether you are a maestro in the realm of marketing, a sagacious financial analyst, or a venerable pedagogue, our charts stand ready to cater to your bespoke needs. Thus, the tribulations of contending with generic chart templates that do disservice to your underlying purpose are a relic of the past.
Our eminence in this field serves as the fulcrum of our distinctiveness. Nurtured over the course of several years, our expertise has evolved to a state of consummate refinement. We possess an intuitive understanding of what resonates efficaciously, and this perspicacity has been meticulously infused into the DNA of our product. Our resolute commitment to the twin pillars of quality and innovation is the crucible in which charts of the highest echelon are wrought, charts that are poised to deliver tangible outcomes.
Assimilate Analytical Graphics Keynote Charts into the tapestry of your presentations, and bear witness to the alchemy they bestow. Avail yourself of our presentations without delay, and commence the alchemical process of transmuting data into narratives that resound with impact. Your audience shall extend their gratitude in abundance.
Retain cognizance that our triumphs align with your triumphs. Permit us to empower your presentations through the enchantment of data visualization.
Origins and Intent:
The provenance of our expertise in data visualization is grounded in a wealth of experience and an unwavering zeal for transmogrifying labyrinthine data into digestible enlightenment. Our endeavor in conceiving this product is undergirded by a lucid purpose - to serve as a catalyst in enabling individuals and organizations to communicate with consummate efficacy through the medium of visual data representation.
This product delineation is intended to address the aspirations of any individual who aspires to augment the allure of their presentations with visuals predicated on data-driven paradigms. Whether you are a luminary in the sphere of commerce, a pedagogue in pursuit of enlightenment, a scholar investigating the enigma of knowledge, or an emissary of benevolent endeavors, our Analytical Graphics Keynote Charts stand ready to align with the arcana of your distinct exigencies.
Copyright © 2009-2024 ImagineLayout All rights reserved.