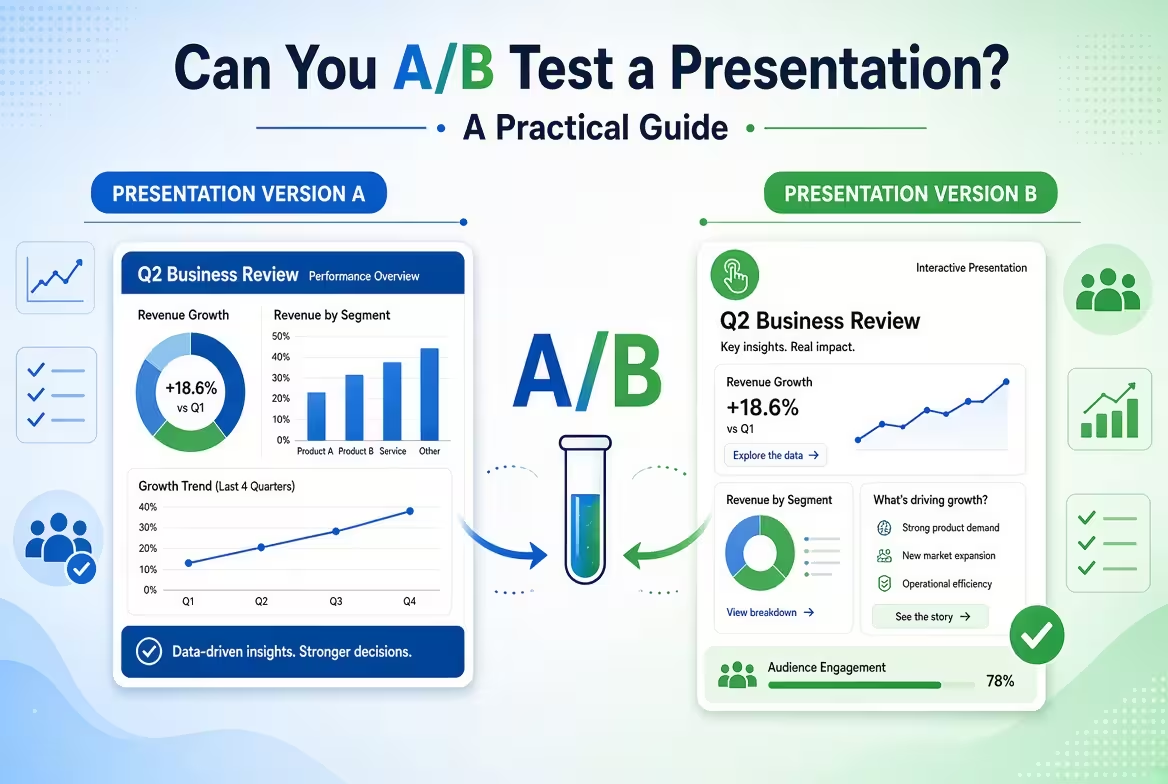
Can two versions of the same presentation produce different results? Absolutely—but there is a catch. A presentation is not a landing page that every visitor sees under identical conditions, so a useful A/B test has to control what changes, who sees it, and what outcome you measure.
For presentation designers, marketers, sales teams, consultants, and founders, that makes A/B testing less about asking “Which slide looks better?” and more about answering a specific question: Does version A cause a different audience response than version B?
What Does A/B Testing a Presentation Actually Mean?
Imagine you have two versions of the same 12-slide sales deck. Version A uses a large product image on slide 4. Version B replaces the image with a comparison diagram.
If you show A to one person and B to another and simply ask which one they like, you have collected feedback—but you have not necessarily run a useful A/B test.
A proper A/B experiment normally involves two or more variants, random assignment, and a predefined outcome you want to compare. Survey platforms such as SurveyMonkey, for example, support randomly showing different images or text variants to different respondents and then comparing their responses.
For a presentation, the tested variable could be surprisingly small:
- headline wording
- opening slide
- chart type
- data visualization
- amount of explanatory text
- order of two slides
- call-to-action wording
- product screenshot versus diagram
- story structure
- entire presentation versions
The smaller the change, the easier it is to understand what caused the difference. If you change the headline, colors, chart, layout, speaker script, and slide order simultaneously, you may discover that one version performed differently—but you will have little evidence about which change mattered.
What Can You Measure?
This is where presentation A/B testing becomes more interesting than a simple design vote.
“Which version do you prefer?” measures preference. That can be useful for a design review, but it is not automatically the same thing as better communication or better business performance.
Depending on the purpose of the presentation, you can measure outcomes such as:
- Comprehension: Can the audience correctly explain the main point afterward?
- Recall: Which key fact, recommendation, or message do they remember?
- Engagement: Do viewers continue through the presentation or interact with a particular element?
- Action: Do they request a demo, download something, book a meeting, or take another intended step?
- Decision quality: When the deck supports a decision, do people reach the intended decision with the same information?
- Confidence: Do viewers feel sufficiently informed to act?
The correct metric depends on the job of the presentation.
A board presentation may be trying to make a decision easier. A sales deck may be trying to generate qualified follow-up conversations. An educational presentation may be trying to improve retention. Treating all three as a contest for “engagement” would measure the wrong thing.
Microsoft also supports live audience interaction in PowerPoint through Microsoft Forms, allowing presenters to collect responses during a presentation and see results in real time. That is useful for feedback and audience participation, although live polling by itself does not establish a controlled A/B experiment.
The Easiest Presentation A/B Test: Test One Slide
If you have never tested a presentation before, don't start by creating two completely different decks.
Take one slide where you suspect the design is affecting comprehension or action. Create two versions.
For example:
- Version A: a conventional bar chart with six categories.
- Version B: the same underlying data presented as a highlighted comparison between the two categories that matter most.
Keep the underlying information constant. Keep the speaker explanation as similar as possible. Randomly assign participants to A or B, then ask the same outcome-focused question.
This setup gives you something valuable that a design critique usually cannot: a cleaner connection between the visual change and the audience response.
For data-heavy presentations, this type of experiment can be particularly useful because changing the visual encoding can alter what the audience notices first without changing the underlying numbers. A template built around editable analytical charts or structured data visualizations can also make it faster to create controlled visual variants. For example, ImagineLayout's Data Visualization Techniques PowerPoint Charts collection provides multiple editable chart layouts that can be adapted for different presentation structures.
Why Testing an Entire Presentation Is Harder
There is a practical problem with testing complete presentations: the presentation is only one part of the experience.
The speaker can change. The room can change. The audience can change. The amount of time available can change. Even the question asked immediately before a slide can affect how people interpret it.
That means a result such as “Deck B performed better” may be misleading if Deck B was delivered by a different presenter to a different audience.
For a live presentation, try to keep the major variables stable:
- same presenter where possible
- same presentation duration
- same audience type
- same delivery environment
- same supporting explanation
- same primary objective
- randomized assignment when practical
There is another limitation: the more you change at once, the less diagnostic your test becomes.
Suppose Deck A has 20 slides and Deck B has 12. Deck B gets higher satisfaction scores. That tells you something, but it does not tell you whether the improvement came from fewer slides, different storytelling, different visual design, or simply reduced exposure time.
For that reason, I often prefer a two-stage approach: first test individual high-impact components, then test the stronger complete version.
Don't Confuse a Design Vote With an A/B Test
Here is a common scenario.
You show two title slides to ten colleagues and eight choose Version B.
It is tempting to conclude that B is the better title slide.
But what have you actually learned?
You have learned that eight people in that particular group preferred B under those particular conditions. You have not necessarily learned that B improves comprehension, recall, conversion, or decision-making.
This distinction matters because attractive design and effective communication can diverge.
A visually striking slide may win a preference test while making the central number harder to find. Conversely, a less fashionable layout may make an important comparison immediately understandable.
If your real objective is comprehension, test comprehension. If your objective is action, test action. The experiment should follow the purpose of the presentation—not the other way around.
A Better Experiment Starts With a Hypothesis
Before creating Version B, write one sentence describing what you expect to change.
For example, a hypothetical hypothesis could be:
“Replacing the six-category chart with a two-category comparison will make the main financial difference easier to identify.”
That is much more useful than:
“Let's make the slide more modern and see what people think.”
The first statement gives you something to test. The second mostly produces opinions.
A simple experiment can therefore be structured around five decisions:
- Hypothesis: What do you expect to change?
- Variant: What exactly differs between A and B?
- Audience: Who needs to be tested?
- Metric: What observable outcome will determine whether the difference matters?
- Decision rule: What result would justify keeping, revising, or discarding the change?
That last point is easy to overlook. Decide what you will do with the result before seeing it. Otherwise, it becomes tempting to reinterpret an ambiguous result after the fact.
Where Presentation A/B Testing Is Most Useful
Not every presentation needs an experiment. If you are preparing a five-minute internal update for six people, spending days running controlled tests is probably unnecessary.
The method becomes more valuable when a presentation is repeated frequently or has a measurable business consequence.
Good candidates include:
- sales presentations used by multiple representatives
- investor or fundraising decks that are shown repeatedly
- webinar presentations with large audiences
- product launch presentations
- training materials delivered to multiple groups
- marketing presentations with a measurable conversion step
- reports where stakeholders repeatedly struggle with the same data
For a recurring business presentation, even a small improvement in one critical slide can be worth investigating because the same communication is repeated many times.
For analytical presentations, structured chart and diagram systems can make this experimentation easier. ImagineLayout's Editable Analytical Charts for Keynote, for example, provides a large collection of editable analytical layouts that can be adapted while keeping the underlying data consistent.
Can You A/B Test a PowerPoint File Directly?
Not in the same straightforward way that you might A/B test a webpage.
PowerPoint is primarily a presentation format, not an experimentation platform. You generally need another mechanism to control who sees which version and to collect the resulting data.
That mechanism could be:
- a randomized survey containing different slide images
- separate presentation sessions
- controlled webinar groups
- different versions of a presentation distributed to defined audiences
- a presentation followed by a standardized questionnaire
The important part is not the software used to display the slides. It is the experimental structure around them.
For example, a survey platform can randomly assign different respondents to different visual stimuli and then compare their responses.
If your goal is simply to collect reactions during a live meeting, interactive PowerPoint features can be enough. Microsoft documents using Forms inside PowerPoint to collect audience responses through a QR code or short URL and display results during the presentation.
What a Useful Presentation Test Report Should Show
Once the experiment is finished, don't present the result as a single “winner” without context.
A useful results slide should show the original question, the tested change, the audience, the metric, and the observed result.
A simple structure might look like this:
- Question: Does the simplified chart improve identification of the main result?
- Variant A: original six-category chart
- Variant B: focused comparison chart
- Audience: defined target audience
- Primary metric: correct identification of the key result
- Result: measured response for each variant
- Decision: what changes in the production presentation
That structure prevents an attractive percentage from becoming the entire story.
When A/B-test results are presented to stakeholders, the methodology matters because audiences can otherwise mistake an inconclusive result for a clear winner. Current guidance on presenting A/B-test results similarly emphasizes connecting the result to the original hypothesis and distinguishing conclusive results from inconclusive ones.
The Most Valuable Test May Not Be About Design
One of the more useful experiments is sometimes the least visually interesting.
Test the order of information.
Suppose a presentation currently introduces the problem, explains the background, shows supporting data, and only then presents the recommendation. Create a second version that states the recommendation earlier and moves the supporting evidence afterward.
The slides may use exactly the same colors, fonts, charts, and images. Only the narrative sequence changes.
If the audience reaches the intended decision more reliably with one structure, you have learned something more transferable than “people liked this design.” You have evidence about how that particular audience processes the argument.
This is also where presentation templates should be treated carefully. A template can accelerate production and give you a consistent visual system, but it should not dictate the experiment. For example, a project-information deck may provide editable structures for timelines, metrics, and comparisons, but the experiment should still be built around the communication question you are trying to answer. ImagineLayout's Project Information PowerPoint Charts is one example of a reusable visual system for this kind of structured business presentation.
A Practical Rule for Deciding What to Test
If a slide is merely decorative, testing it rarely deserves much effort.
If a slide carries a decision, explains a complex relationship, communicates a critical number, or asks the audience to take action, it becomes a much more interesting candidate.
Start there.
Pick one communication problem, create one controlled alternative, define the outcome before testing, and expose the two versions to comparable audiences. You may discover that the winning change is a chart, a headline, a slide order—or something much less glamorous.
That is the real advantage of A/B testing a presentation: it moves the discussion from “Which design do we like?” toward a more useful question—“Which version works better for the job this presentation actually has to do?”
Comments (0)