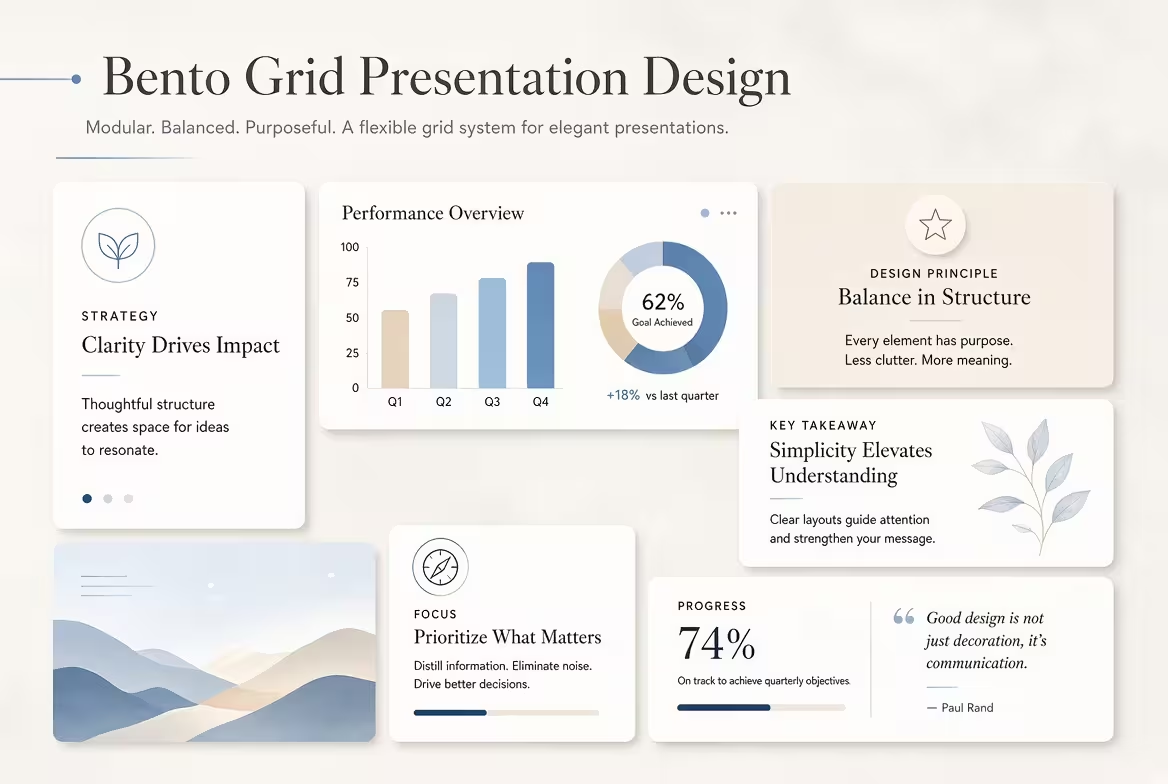
A bento grid can make a presentation look remarkably polished—and remarkably similar to a SaaS product page.
That distinction matters. The same modular cards that work beautifully for a product dashboard can make a strategy deck feel like an interface rather than a presentation. For designers, consultants, marketers, and anyone building serious PowerPoint or Keynote decks, the real challenge is not learning how to draw the boxes. It is deciding what those boxes are supposed to communicate.
This guide looks at bento grid presentation design as a composition system, not simply a visual trend: when to use it, how to create hierarchy without turning every slide into a dashboard, and how to introduce enough variation that the deck still feels editorial and human.
What a Bento Grid Actually Does on a Presentation Slide
The easiest way to misunderstand a bento grid is to think of it as a collection of rounded rectangles.
The useful part is not the rounded corner. It is the compartmentalization. A bento layout gives separate pieces of information their own physical territory while keeping them inside one larger composition. A large area can carry the central message; smaller areas can provide evidence, context, a number, image, diagram, or secondary observation.
That makes the layout particularly useful when a slide contains several different types of information that belong to the same idea.
For example, an executive strategy slide might contain:
- a large statement describing the strategic direction;
- a smaller metric showing the scale of the opportunity;
- a supporting chart;
- a short risk note;
- an image or product reference.
Putting all five elements into one conventional text-and-chart layout can create awkward compromises. A modular composition gives each element a defined role.
But there is an important difference between a presentation bento grid and a UI card layout: a presentation still has to control the order in which the audience understands the information.
A dashboard can tolerate several independent points competing for attention because the user chooses what to inspect. A presentation has a presenter—or a narrative—and therefore needs a more deliberate reading path.
Why Bento Slides Start Looking Like Apps
Consider a common modern slide: dark background, six rounded cards, small icons, tiny labels, one number in each card, subtle gradients, and perhaps a device mockup.
Nothing is necessarily wrong with the individual components. The problem is that the composition has inherited the logic of an interface.
Interfaces are designed around interaction and scanning. Presentation slides are designed around communication and progression.
That difference creates several warning signs.
- Every tile behaves like a feature card. If every module contains an icon, headline, and two lines of supporting text, the slide begins to resemble a pricing page.
- Every tile has equal visual importance. The audience sees a wall of information rather than a message with supporting evidence.
- The content is too small. UI layouts can assume close viewing and interaction. A projected presentation cannot.
- Decorative UI language replaces meaning. Pills, status labels, micro-icons, gradients, and interface controls can make a slide look sophisticated while adding no explanatory value.
- The same card structure appears on every slide. The deck becomes visually consistent but narratively flat.
The last problem is particularly easy to miss. A bento system can be perfectly aligned and still produce a monotonous presentation because the underlying content has been forced into the same visual container repeatedly.
In other words, consistency should apply to the design system, not necessarily to the silhouette of every slide.
Build the Hierarchy Before You Draw the Grid
One practical test I use for modular layouts is to remove the text and look only at the relative areas.
If the largest tile does not contain the most important idea, the grid is already sending the wrong message.
Bento layouts naturally create hierarchy through area. A 2×2 module feels more important than a 1×1 module before anyone reads the typography. That makes size a communication device, not merely a layout decision.
A useful structure is:
- One anchor: the idea the audience should remember.
- Two or three supporting modules: evidence, explanation, or consequences.
- Optional utility modules: a metric, source, date, or small contextual detail.
The mistake is trying to give every piece of information its own “important” card.
If everything is promoted, nothing is promoted.
This is where bento presentation design differs from simply replacing bullet points with cards. The grid should encode the argument. A large module might establish the problem, while two smaller modules explain the cause and evidence. A wide bottom module might then show the recommended action.
The geometry becomes a visual version of the reasoning.
Use Unequal Modules, but Do Not Turn the Slide Into Tetris
Deliberate asymmetry is one of the reasons bento layouts work. But there is a point where asymmetry stops creating hierarchy and starts creating visual noise.
A useful constraint is to work with a small number of recurring proportions rather than inventing a different shape for every module.
For example, a slide might use:
- one large 2×2 anchor;
- two 1×1 supporting blocks;
- one horizontal 2×1 block.
The exact dimensions are less important than the relationship between them. The audience should be able to understand the composition almost instantly.
There is also a practical production advantage. When your grid uses a limited set of proportions, you can reuse the underlying system across a deck without making every slide look identical.
This is one place where a prepared presentation asset can save more time than a blank canvas. ImagineLayout's Useful Squares PowerPoint chart collection, for example, provides square-based structures that can be adapted into modular compositions rather than rebuilt from scratch.
The goal is not to make every slide a puzzle. It is to create a controlled vocabulary of shapes that lets the content change while the underlying design logic remains recognizable.
The Content Inside the Tile Determines Whether the Design Feels Editorial or Like UI
This is the part that is often overlooked.
You can take exactly the same grid and make it feel completely different by changing what occupies the modules.
A UI-oriented version might contain:
- “Fast”;
- “Secure”;
- “24/7”;
- “99.9%”;
- an icon;
- a small product screenshot.
A presentation-oriented version could instead contain:
- a provocative thesis;
- a real chart;
- a photograph with a specific caption;
- a short quotation;
- a comparison;
- a diagram explaining a relationship.
The second version has more editorial variation. The modules do not all behave like miniature product features.
This is particularly useful for business presentations. One tile can be visual, another analytical, another textual, and another structural. Their commonality comes from the grid, typography, spacing, and visual language—not from forcing every module into the same card template.
For data-heavy slides, a matrix can also be more honest than a collection of decorative cards. ImagineLayout's Creative Matrix PowerPoint chart template is a useful reference for this kind of structured information because its layouts treat the grid as a way to express relationships rather than merely decorate content.
When a Bento Grid Is the Wrong Choice
Not every slide benefits from compartmentalization.
If the audience needs to follow one continuous argument, a visible grid can work against the message. A timeline, process, narrative sequence, quotation, full-slide photograph, or detailed chart may communicate better without multiple compartments competing for attention.
I would be especially cautious with:
- Opening slides built around one emotional idea. A mosaic can dilute the impact of a single statement.
- Detailed analytical charts. The chart may need the entire canvas to remain legible.
- Step-by-step processes. A sequence should usually look sequential rather than fragmented.
- Long-form explanations. Splitting paragraphs into cards does not make dense writing easier to present.
- Slides where the audience must compare two things precisely. A conventional comparison structure can make the relationship clearer than an asymmetrical mosaic.
The most effective bento decks therefore are not necessarily decks where every slide uses bento.
A stronger approach is to treat the grid as one composition mode inside a larger presentation system.
That gives you permission to move from a bento overview to a full-width chart, then to a timeline, then back to a modular summary. The deck feels designed rather than generated from one template.
How to Create a Bento Grid System for a Whole Deck
Instead of designing twenty independent bento slides, establish a small system first.
Define the grid, outer margins, gutter, corner treatment, typography scale, and a handful of module proportions. Then decide which content types are allowed to occupy each module.
For example, a presentation system could have:
- a large statement module;
- a metric module;
- a chart module;
- a visual/image module;
- a comparison module;
- a process or diagram module;
- a small source or annotation module.
Now the system can generate different compositions without becoming visually random.
ImagineLayout's Analytics PowerPoint template is relevant when the content moves toward dashboards, trends, funnels, scatter plots, or heat maps. The important design lesson is not to copy its structure literally, but to recognize that analytical content needs modules capable of carrying actual information rather than decorative filler.
Then introduce one deliberate rule: not every slide needs the same number of modules.
A five-module overview followed by a two-module argument slide will usually feel more natural than forcing both into the same six-card structure.
A Practical Test Before You Keep the Slide
Before presenting a bento slide, shrink it until the text is difficult to read.
At that size, ask three questions:
- Can I immediately tell which area matters most?
- Can I understand the relationship between the major modules?
- Does the slide still look like a presentation, rather than a screenshot of an application?
If the answer to the third question is no, remove interface-specific decoration before changing the grid itself.
Often the problem is not the bento structure. It is the accumulation of UI signals: tiny labels, excessive icons, status pills, miniature controls, product-like shadows, and identical feature cards.
Strip those away and the underlying modular composition may become much stronger.
That is the useful distinction to keep in mind: bento is a way of organizing information; “app-like” is a visual language layered on top of that organization. You can use the first without automatically adopting the second.
The best bento presentation is therefore not the one with the most cards or the most futuristic styling. It is the one where the geometry makes the information easier to understand before the audience has time to admire the design.
When the grid starts dictating the content instead of helping it, break the grid. A presentation is allowed to have one large image, one chart, one sentence, or one diagram. The modular system should serve those moments—not prevent them.
Comments (0)