


Type: PowerPoint Charts template
Category: Relationship
Sources Available: .pptx
Product ID: PC00541
Template incl.: 22 editable slides
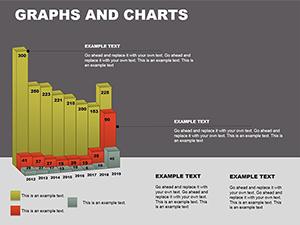
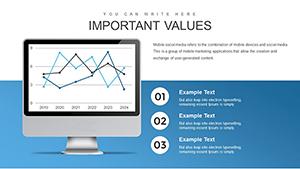
Download our Graphs of Economic Indicators PowerPoint charts for free. Enhance your presentations with our customizable templates. Suitable for professionals in various fields.
Welcome to our website, where you can download high-quality and customizable Graphs of Economic Indicators PowerPoint charts for free. As a leader in the presentation template industry, we offer a wide range of professionally designed templates that are perfect for professionals in various fields.
Our Graphs of Economic Indicators PowerPoint charts are specifically designed to help you create visually appealing and informative presentations. With our templates, you can effectively showcase economic data, trends, and analysis to captivate your audience.
We understand the importance of customization when it comes to presentations. That's why our Graphs of Economic Indicators PowerPoint charts offer a variety of customization options. You can easily modify the colors, fonts, sizes, and styles to match your brand identity or presentation theme.
Our Graphs of Economic Indicators PowerPoint charts are suitable for professionals from various backgrounds, including economists, analysts, financial experts, business consultants, educators, and more. Whether you're delivering a keynote speech, conducting a business meeting, or teaching a class, our templates will add professionalism and clarity to your presentations.
Get started today by downloading our Graphs of Economic Indicators PowerPoint charts for free. Simply click the download link and save the template file (pptx) to your computer. With our templates, you can save time and effort in creating visually appealing presentations while maintaining a high level of professionalism.
We strive to provide top-notch presentation templates that cater to the diverse needs of professionals. Our Graphs of Economic Indicators PowerPoint charts offer a perfect blend of functionality, customization, and visual appeal. Download our templates for free and elevate your presentations to the next level.


Copyright © 2009-2024 ImagineLayout All rights reserved.