Analyze Two Related Indicators PowerPoint Charts Template

#0
#1
#2
#3
#4
#5
#6
#7
#8
#9
#10
#11
#12
#13
#14
#15
#16
#17
#18
#19
#20
#21
#22
#23
#24
#25
#26
#27
#28
#29
  • thumbnail slide #0
  • thumbnail slide #1
  • thumbnail slide #2
  • thumbnail slide #3
  • thumbnail slide #4
  • thumbnail slide #5
  • thumbnail slide #6
  • thumbnail slide #7
  • thumbnail slide #8
  • thumbnail slide #9
  • thumbnail slide #10
  • thumbnail slide #11
  • thumbnail slide #12
  • thumbnail slide #13
  • thumbnail slide #14
  • thumbnail slide #15
  • thumbnail slide #16
  • thumbnail slide #17
  • thumbnail slide #18
  • thumbnail slide #19
  • thumbnail slide #20
  • thumbnail slide #21
  • thumbnail slide #22
  • thumbnail slide #23
  • thumbnail slide #24
  • thumbnail slide #25
  • thumbnail slide #26
  • thumbnail slide #27
  • thumbnail slide #28
  • thumbnail slide #29

Type: PowerPoint Charts template

Category: Cycle, Pie

Sources Available: .pptx

Product ID: PC00175

Template incl.: 30 editable slides

Purchase this template
$ 20.00

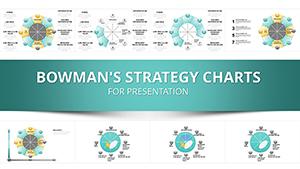
Enhance your presentations with our Analyze Indicators PowerPoint Charts template. Perfect for data-driven insights and professional reports. Download now!

Enhance Your Presentations with Data-Driven Insights

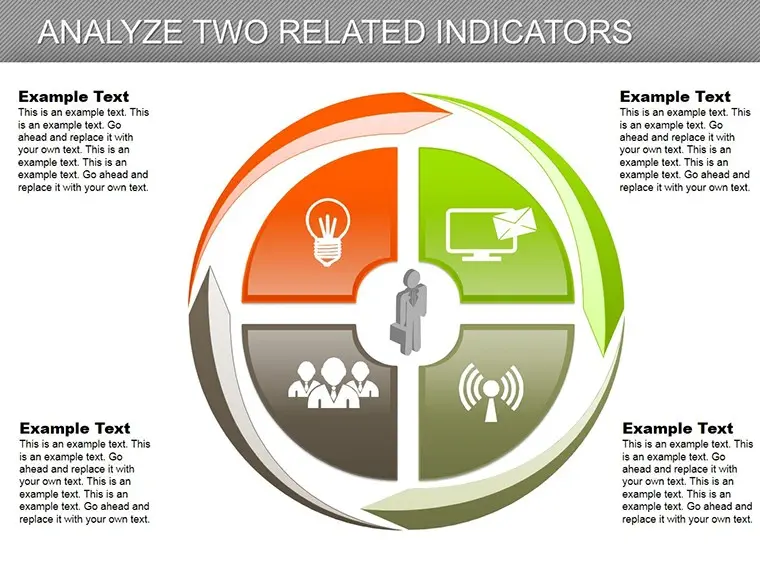
Deliver impactful presentations with our Analyze Indicators PowerPoint Charts template. Designed for professionals seeking to visually represent and analyze complex data.

Key Features:

  • Comprehensive Collection: Access a wide range of chart designs tailored for data analysis.
  • Customization Options: Easily modify colors, fonts, and layouts to match your brand and message.
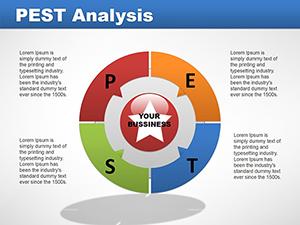
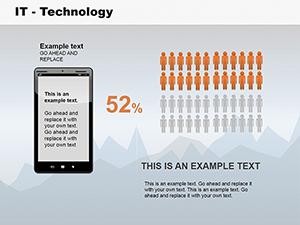
  • Data Visualization: Transform raw data into compelling visuals that resonate with your audience.
  • Editable Charts: Effortlessly update charts to reflect the latest data and insights.
  • Strategic Insights: Present indicators, trends, and patterns for informed decision-making.

Who Can Benefit:

Our Analyze Indicators PowerPoint Charts template is ideal for:

  • Business Analysts
  • Financial Experts
  • Market Researchers
  • Project Managers
  • Academic Professionals

Whether you're preparing quarterly reports, academic presentations, or client pitches, this template will elevate your content and help you convey insights effectively.

Why Choose Our Presentation Template:

Experience the following advantages when you download our Analyze Indicators PowerPoint Charts template:

  • Time-Saving: Start with a professionally designed foundation and focus on your content.
  • Visual Excellence: Impress your audience with visually appealing charts and graphs.
  • Flexibility: Customize templates to match your unique style and requirements.
  • Engagement: Capture and maintain audience attention through impactful data visualization.

Download our Analyze Indicators PowerPoint Charts template today and elevate your presentations to a new level of professionalism.

Circular Reliance PowerPoint Charts Template - Presentation
ID: #PC00157
Circular Reliance PowerPoint Charts Template - Presentation
8 Parts Real Estate Market PowerPoint Charts Template
ID: #PC00170
8 Parts Real Estate Market PowerPoint Charts Template
Arrows Analysis PowerPoint Charts Template
ID: #PC00168
Arrows Analysis PowerPoint Charts Template
3D Puzzles PowerPoint Charts Template | Download Now
ID: #PC00010
3D Puzzles PowerPoint Charts Template | Download Now
Infographic charts: Bowmans Strategic Clock template for PowerPoint presentation
ID: #PC00019
Infographic charts: Bowmans Strategic Clock template for PowerPoint presentation
Traffic Signs PowerPoint Charts Template for Presentations
ID: #PC00031
Traffic Signs PowerPoint Charts Template for Presentations
Pest Analysis PowerPoint Charts
ID: #PC00041
Pest Analysis PowerPoint Charts
IT Technology PowerPoint Charts
ID: #PC00136
IT Technology PowerPoint Charts