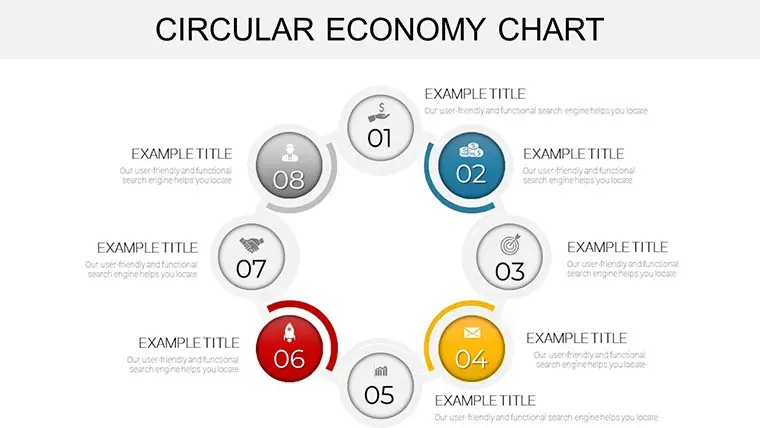

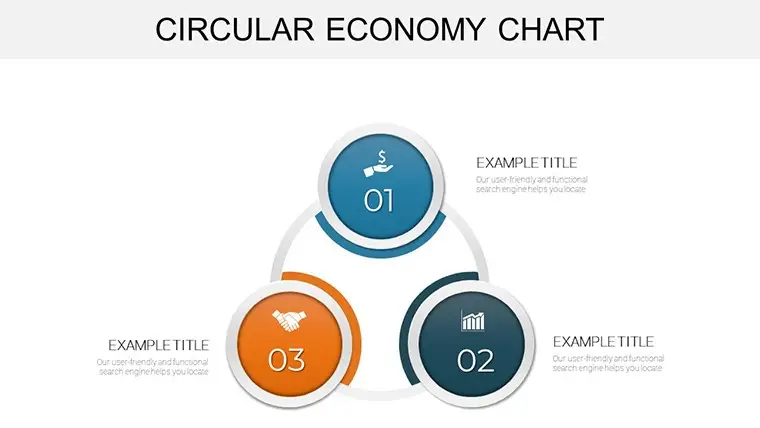


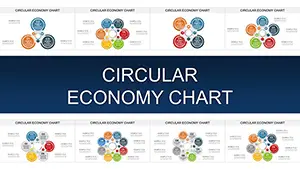
Circular Economy Charts are an essential tool for PowerPoint presentations that aim to educate and inform about the principles of a circular economy. Circular Economy Charts provide a visual representation of the cyclical nature of the economy, emphasizing the importance of reducing waste, reusing resources, and recycling materials.
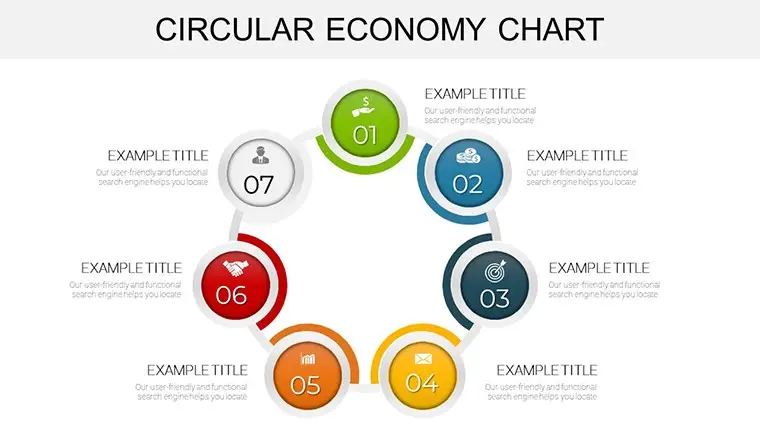
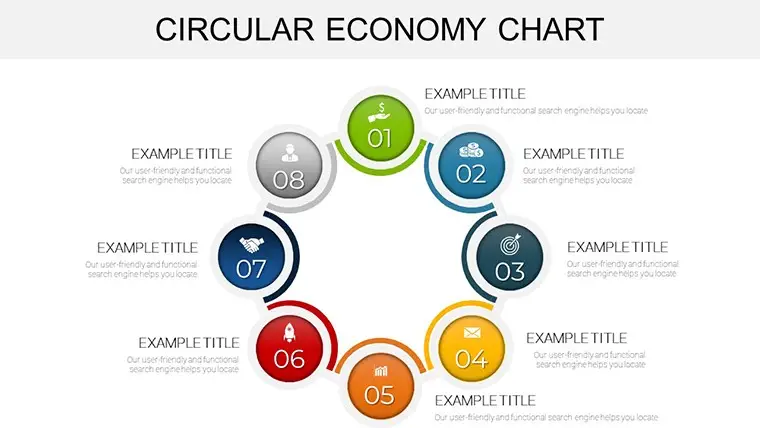
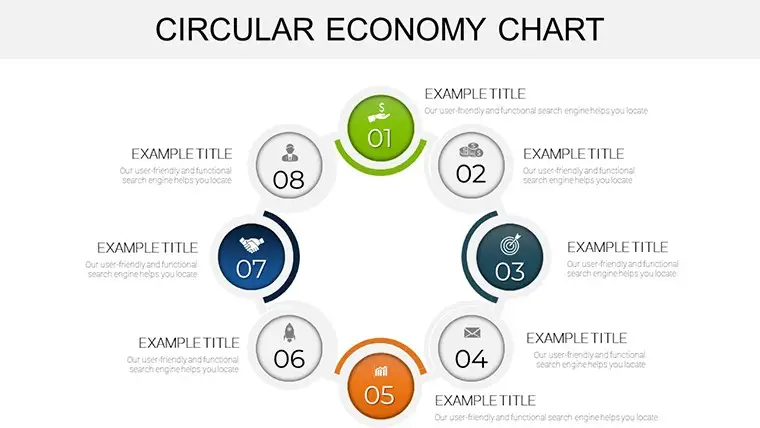
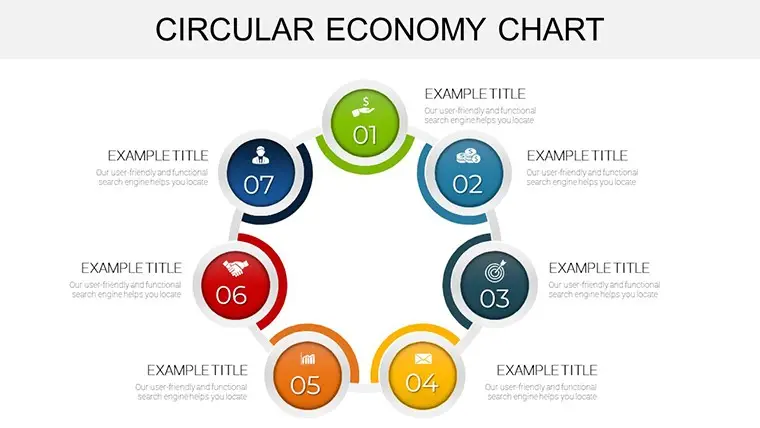
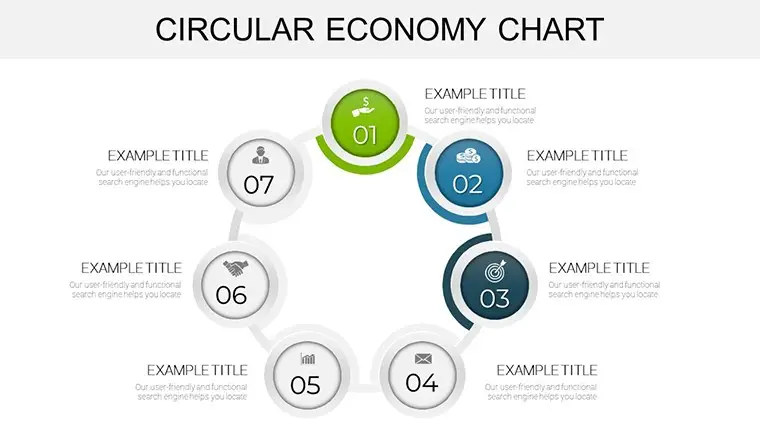
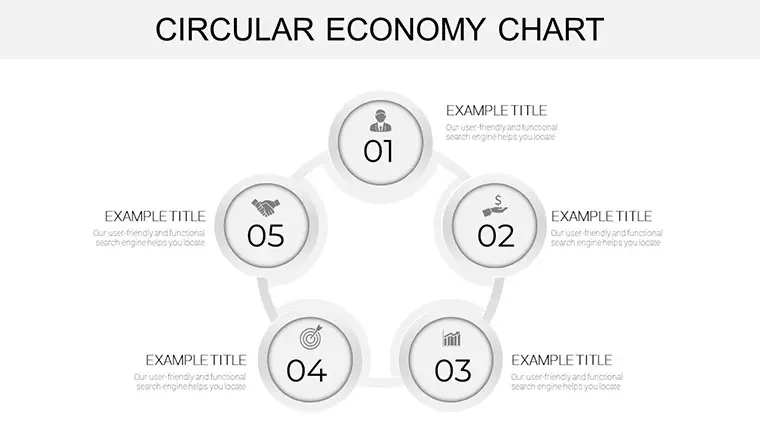
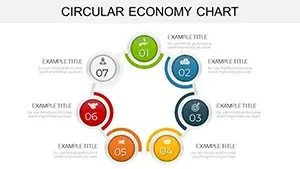
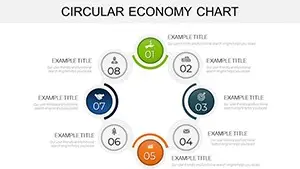
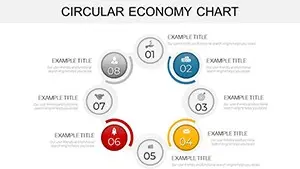
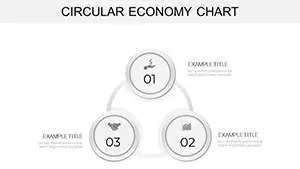
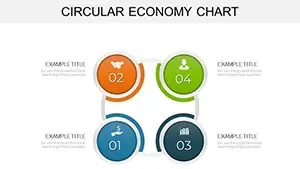
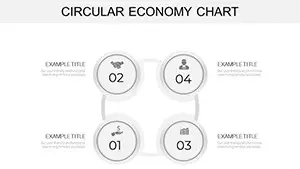
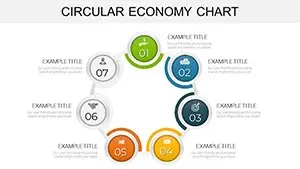
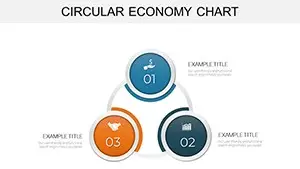
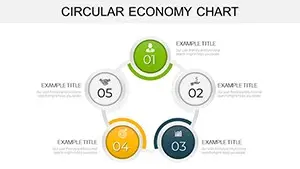
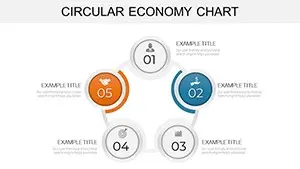
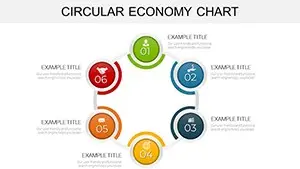
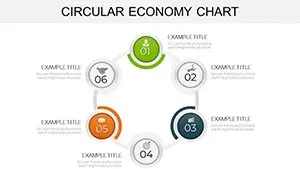
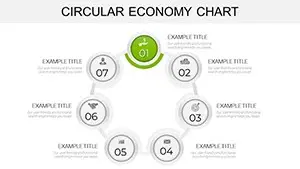
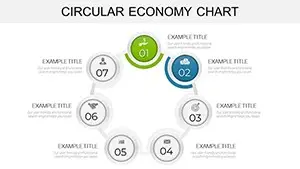
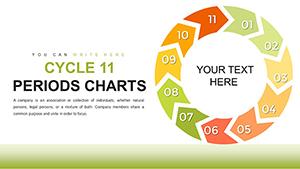
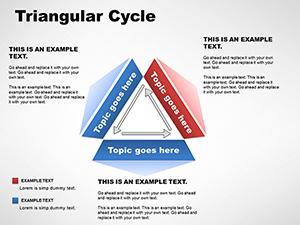
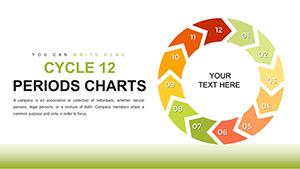
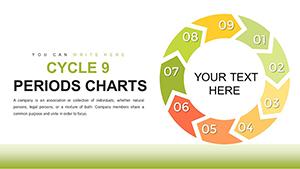
Circular Economy Charts typically include a series of interconnected circular diagrams that depict the various stages of a circular economy, including material sourcing, product design, manufacturing, distribution, consumption, and disposal. The charts may also include information on the benefits of a circular economy, such as reduced environmental impact, increased resource efficiency, and economic benefits.
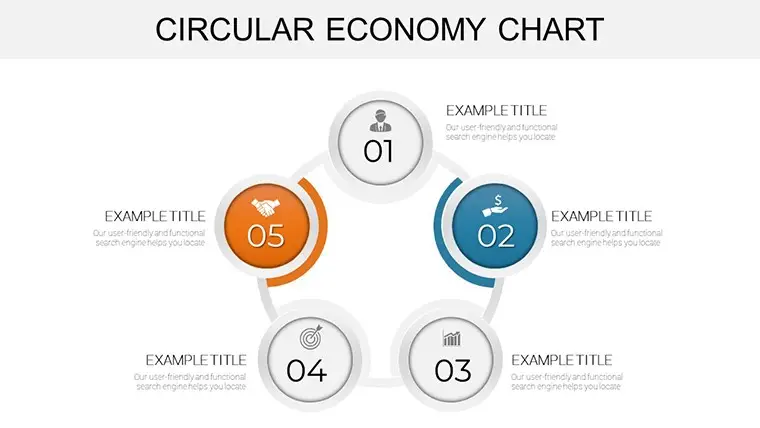
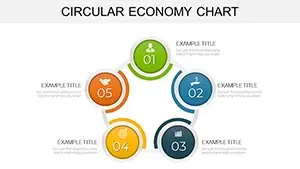
In a PowerPoint presentation, Circular Economy Charts can be used to help audiences understand the complexity of the circular economy, and to highlight the interdependence of different stages in the process. They can also be used to demonstrate how circular economy principles can be applied in various industries, such as manufacturing, agriculture, and construction.
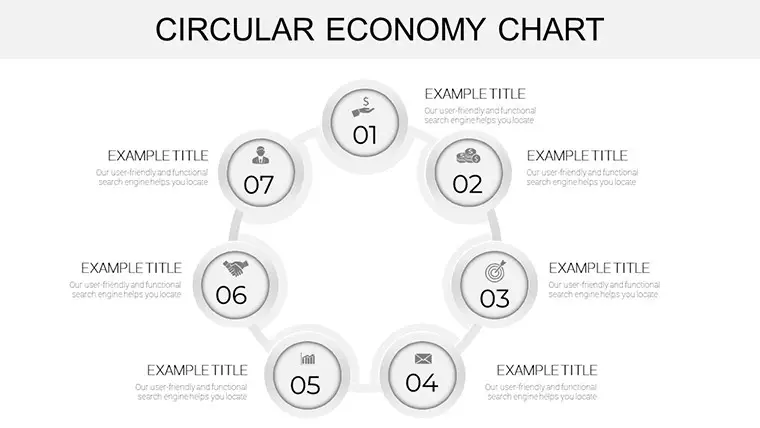
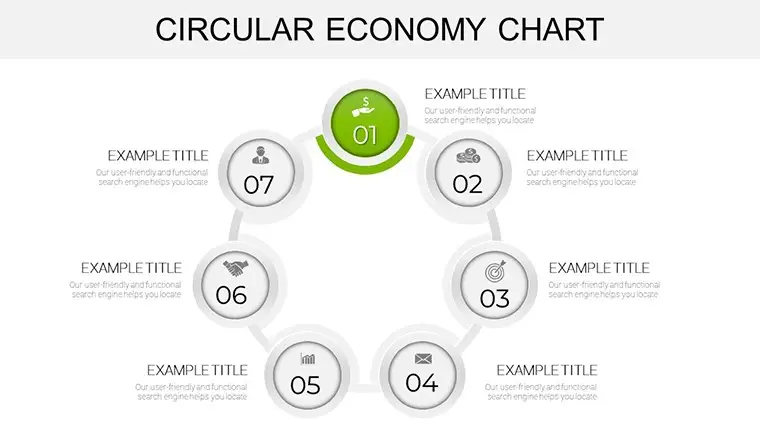
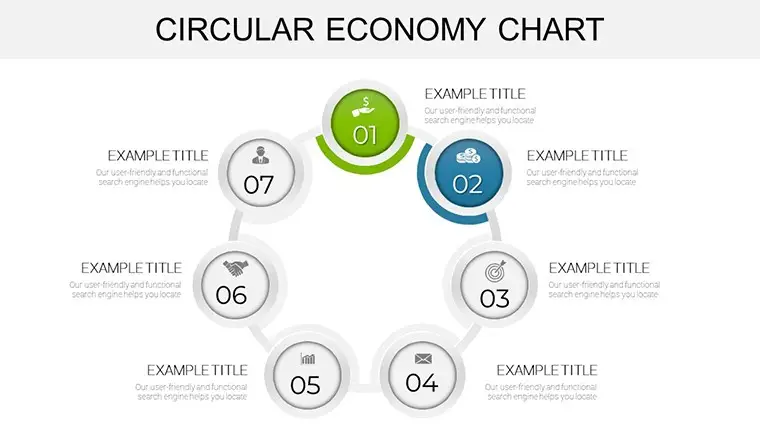
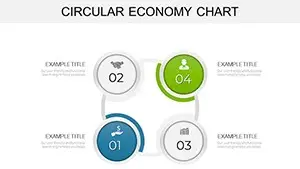
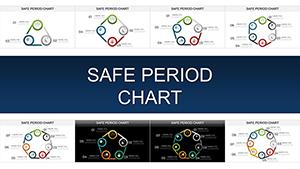
Circular Economy Charts are typically designed to be visually appealing, with bright colors and clear, easy-to-read text. They can be customized to fit the specific needs of a presentation, such as incorporating company branding or highlighting specific aspects of the circular economy that are relevant to the audience.
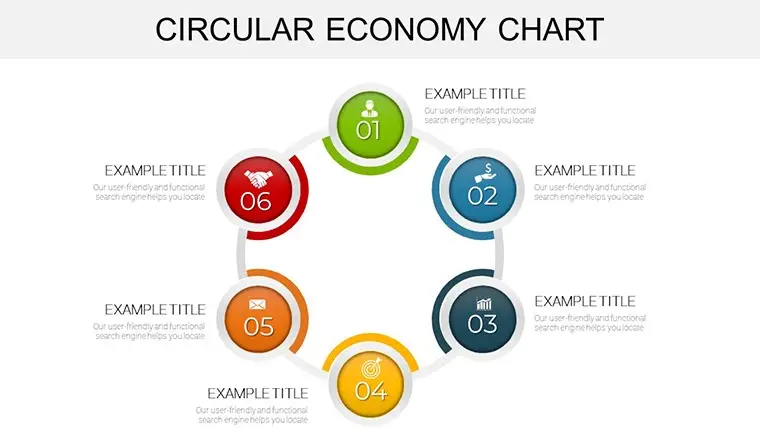
Overall, Circular Economy Charts are an effective way to communicate the principles and benefits of a circular economy in a clear and concise manner, making them a valuable addition to any PowerPoint presentation focused on sustainability, environmentalism, or responsible business practices.
Copyright © 2009-2024 ImagineLayout All rights reserved.