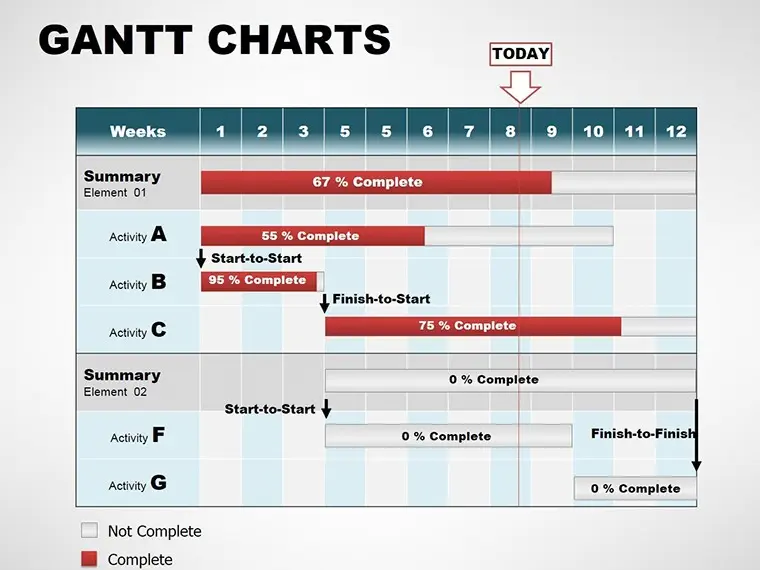
Gantt chart for Keynote presentation accurately indicates the sequence of work on a calendar, calendar of work: dates, and promotional plans. Download Gantt Keynote charts here! Gantt chart is a project management tool illustrating a project plan. It usually consists of two parts: on the left side there is a list of tasks, and on the right side there is a timeline with bars that depict the work. The Gantt chart can also include start and end dates for tasks, milestones, dependencies between tasks, and performers. To keep up with the demands of modern software development, road mapping include a drop-down list of tasks, asset dashboards, and more. These Gantt Keynote chart tools help teams stick to a consistent project strategy despite the iterative nature of the software development process.
Related Templates
ID: #KC00536
Business Gantt Keynote charts
ID: #KC00929
Business Process Management Keynote charts
ID: #KC00176
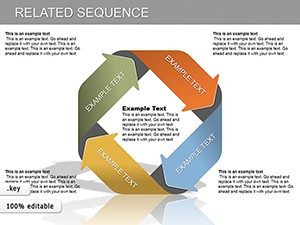
Related Sequence Keynote charts
ID: #KC00213
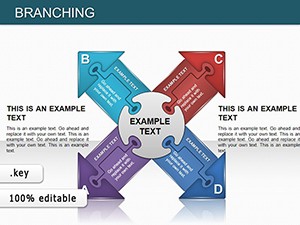
Branching Keynote charts
ID: #KC00546
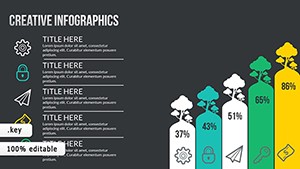
Business Ideas Work Keynote charts
ID: #KC00550
Evolution of Business Process Management Keynote charts