


Type: Keynote Charts template
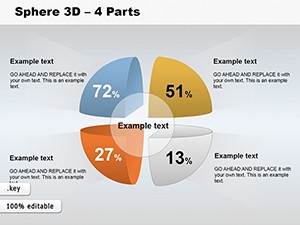
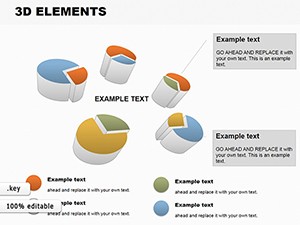
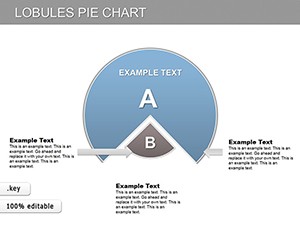
Category: Pie
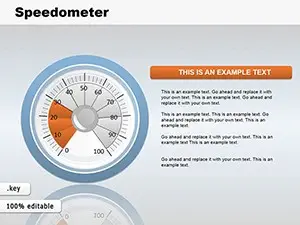
Sources Available: .key
Product ID: KC00633
Template incl.: 4 editable slides
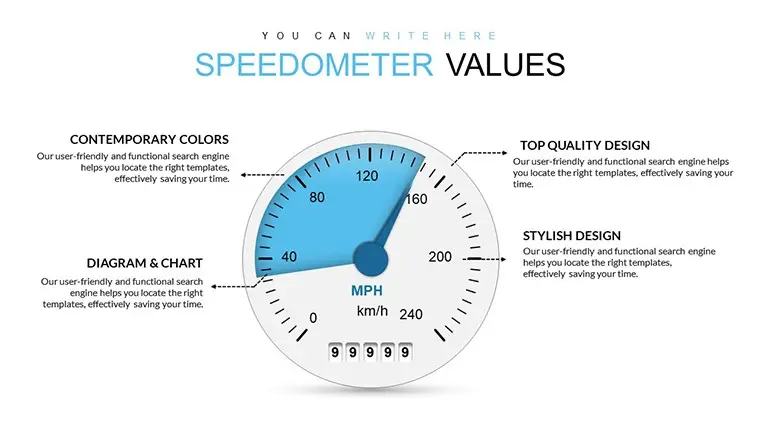
Enhance your presentations with Speedometer Values Keynote Charts. Download our editable infographic presentation template and create professional visualizations. Ideal for business professionals and educators.
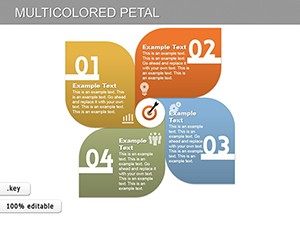
Are you looking to create impactful presentations that captivate your audience? Our Speedometer Values Keynote Charts provide the perfect solution. Designed to elevate your visual storytelling, this editable infographic presentation template offers a variety of customization options to suit your needs.
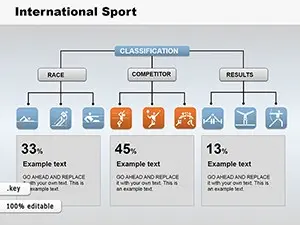
With our Speedometer Values Keynote Charts, you can effortlessly communicate complex data in a visually appealing manner. Whether you're showcasing performance metrics, sales figures, or project milestones, these charts provide a clear and concise way to convey information.
We understand the importance of maintaining brand consistency. That's why our template allows you to customize colors, fonts, and styles to match your brand identity. Tailor the presentation to your specific message and create a cohesive visual experience that resonates with your audience.
Our Speedometer Values Keynote Charts are ideal for business professionals and educators alike. Whether you're delivering a sales pitch, conducting a training session, or presenting research findings, these charts will add professionalism and impact to your slides.
Ready to take your presentations to the next level? Download our editable infographic presentation template today and unlock the power of visual storytelling. Impress your audience with stunning visuals and make a lasting impression.
Unlock the potential of your presentations with our Speedometer Values Keynote Charts. Download our infographic presentation template and deliver compelling visuals that leave a lasting impression.


Copyright © 2009-2024 ImagineLayout All rights reserved.