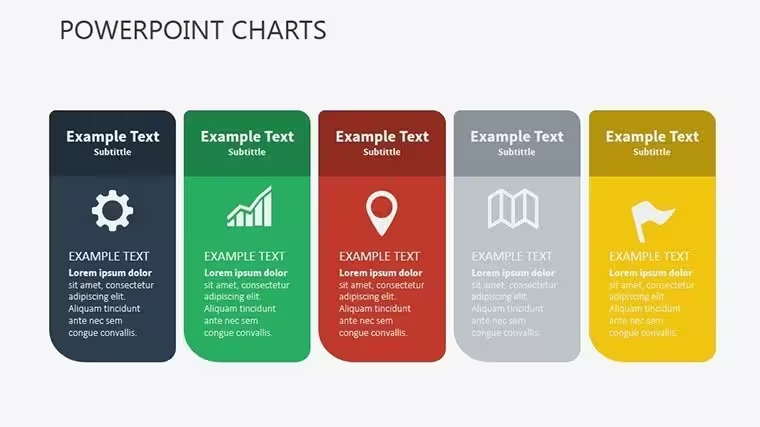
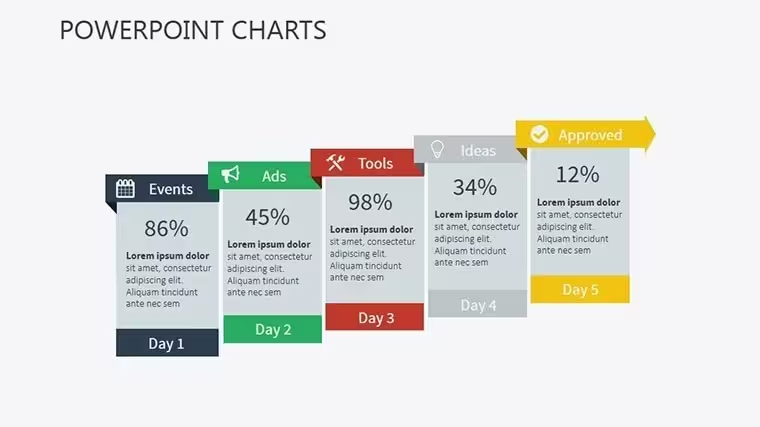
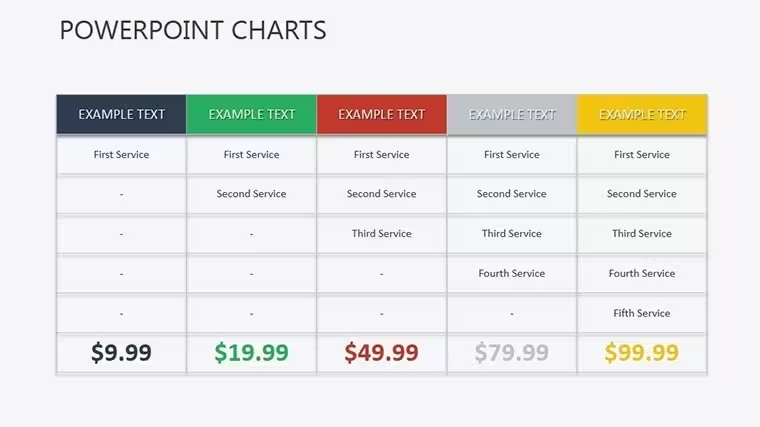
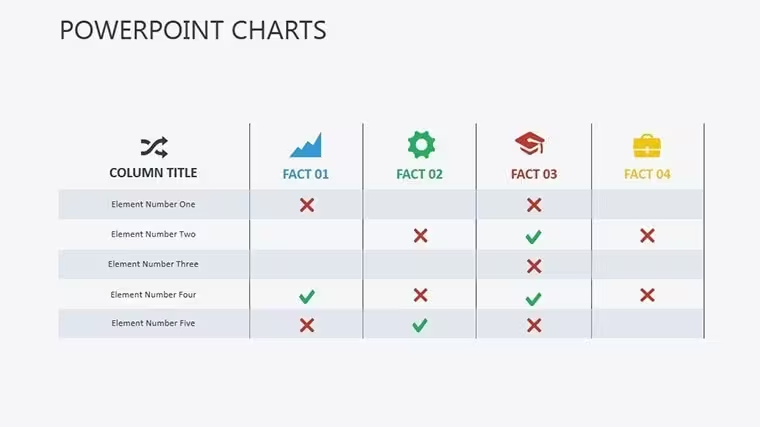
 Click to zoom
Starting Business Keynote Charts: Blueprint Your Path to Profitable Growth
| Format | .pptx |
| Slides | 12 unique layouts |
| Aspect ratio | 16:9 |
| Compatibility | PowerPoint |
| Animated | No |
| Language | English |
| License | Commercial |
| File size | — |
| Version | v1.0 |
| Last updated | September 2026 |
What's inside
Launching a startup is like navigating uncharted waters - exhilarating, yet riddled with forecasts that could sink or sail your ship. Our Starting Business Keynote Charts template is your compass: 12 editable slides engineered for Keynote entrepreneurs who crave structured visuals to crystallize strategies, tally losses, and project profits. Envision pitching to VCs at a demo day, where your SWOT matrix doesn't just list threats but animates risk mitigations, turning "what if" into "watch this."
At $15, this .key powerhouse sports a crisp, motivational palette - steel grays for stability, golden accents for opportunity - in widescreen glory. Backed by lean startup methodologies from Eric Ries' playbook, it's 100% customizable, with master slides that propagate changes across your deck. Whether solo bootstrapping or scaling a team, these charts bridge the gap between idea and execution, making your business plan a living, breathing document.
Key Features That Anchor Your Business Narrative
Inspired by SBA (Small Business Administration) templates, this set prioritizes modularity - swap quadrants in a Boston Matrix or recalibrate P&L projections without breaking a sweat. Keynote's timeline tools amplify the interactivity, letting you simulate scenarios like cash flow dips during market pivots.
- Strategic Mapping Tools: Gantt charts for milestone tracking (Slide 4) and value chain diagrams that dissect operations - vital for ops-heavy startups like e-commerce logistics.
- Financial Fluency: Editable balance sheets and break-even analyses with formula-linked cells; input your burn rate, and projections update in real-time.
- Visual Storytelling Aids: 60+ icons (lightbulbs for innovations, charts for metrics) that inject personality, ensuring your deck feels dynamic, not droning.
Founders from Y Combinator cohorts have leveraged akin visuals to raise seed rounds - think a burn rate funnel (Slide 9) that spotlights runway extensions, making your ask irresistible.
Slide Spotlight: Crafting Your Business Story Step by Step
From ideation to iteration, each slide builds momentum. Slide 0: Executive Snapshot - a dashboard fusing KPIs like TAM (Total Addressable Market) and unit economics, with pie-in-sky projections hyperlinked to appendices.
- Slides 1-3: Market and Strategy - Porter's Five Forces radar and canvas models for lean validation. For tech startups, Slide 2's user acquisition funnel maps viral coefficients, editable for cohort tweaks.
- Slides 4-6: Operations and Team - Org charts with drag-and-drop roles and process flows for supply chains. Animate Slide 5's timeline to phase in hires, aligning with funding tranches.
- Slides 7-9: Financials Forefront - Waterfall for profit waterfalls and scenario sliders for sensitivity analysis. Essential for service-based ventures; Slide 8's DCF model auto-computes NPV with rate adjustments.
- Slides 10-11: Risks and Roadmap - Monte Carlo simulations via scatter plots and closing vision boards, embedding video testimonials for emotional pull.
Outshining basic Excel embeds, this template's native Keynote smarts cut revision cycles by half - pure efficiency for time-strapped founders.
In the Trenches: Use Cases for Aspiring Moguls
You're a food tech innovator prototyping delivery apps. Harness the competitive landscape maps (Slide 1) to benchmark against DoorDash, highlighting your edge in sustainable packaging - data that sways eco-focused angels. Or, in consulting gigs, the revenue forecast lines (Slide 7) project billable hours, factoring seasonal lulls to demonstrate resilience.
Real wins? A bootstrapped SaaS outfit used our PESTLE wheels (Slide 3) to navigate regulatory hurdles, securing a $200K bridge - evidence that vivid charts convert conviction into capital. Perks include investor buy-in (visuals boost recall 40%, per MIT research) and agile planning.
Insider Tips to Supercharge Your Startup Deck
Link slides to Notion boards for collaborative edits, or use Keynote's presenter notes for hidden assumptions. Add a dash of wit: Label a risk slide "The Plot Twists We Saw Coming" to disarm nerves. For global scalability, opt for Unicode fonts ensuring cross-border clarity.
Don't let great ideas gather dust - let these charts propel them forward. Empower your launch with the Starting Business Keynote Charts template - download now and script your success story!
Frequently Asked Questions
Q: Does it include financial formulas for projections?A: Yes, pre-built with Keynote-compatible math; link to cells for dynamic updates on revenues and expenses.
Q: How suitable is this for non-tech startups?A: Perfectly - adapt for retail or services with customizable sectors in the market analysis slides.
Q: Can I collaborate in real-time with this template?A: Share via iCloud; multiple users edit simultaneously in Keynote on Mac/iPad.
Q: Are there templates for exit strategies?A: Slide 11 covers roadmaps; extend with add-ons from our library for M&A visuals.
Q: What's the file compatibility beyond Keynote?A: Export to PowerPoint via .pptx or PDF for Windows teams.
Good for
- Project roadmaps and sprint plans
- Product launch timelines
- Quarterly or annual review decks
- Company history and milestone summaries
Licence
reviews
I was rushing through a marketing assignment and these charts helped a lot.
The arrow graphics actually made my boring stats easier to explain.
Pretty decent template if you just need something quick without thinking too much.
I changed almost all the colors but the structure was useful.
Slides loaded fine on my Mac which surprised me honestly.
FAQ
Will it work in Google Slides?
Are fonts embedded?
Can I use this for client work?
What's the refund policy?
Do you update the template after purchase?
Similar templates
See all Keynote Charts →
All 12 slides