 Click to zoom
Brand Metrics That Matter PowerPoint Template with Editable Charts
| Format | .pptx |
| Slides | 24 unique layouts |
| Aspect ratio | 16:9 |
| Compatibility | PowerPoint |
| Animated | No |
| Language | English |
| License | Commercial |
| File size | — |
| Version | v1.0 |
| Last updated | July 2026 |
What's inside
Overview
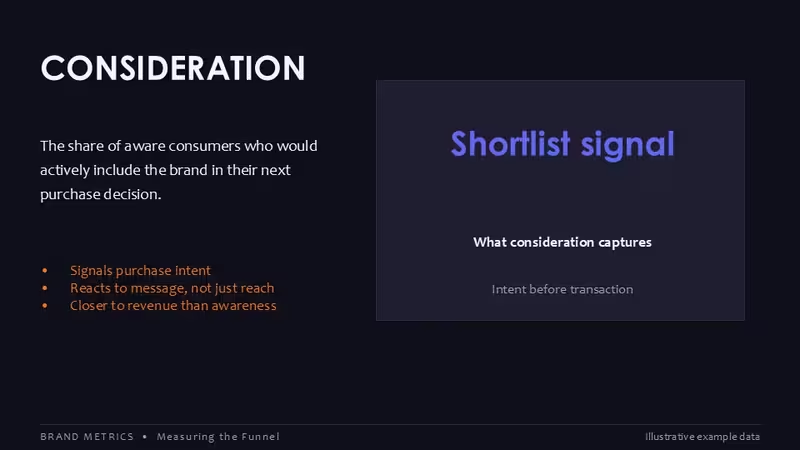
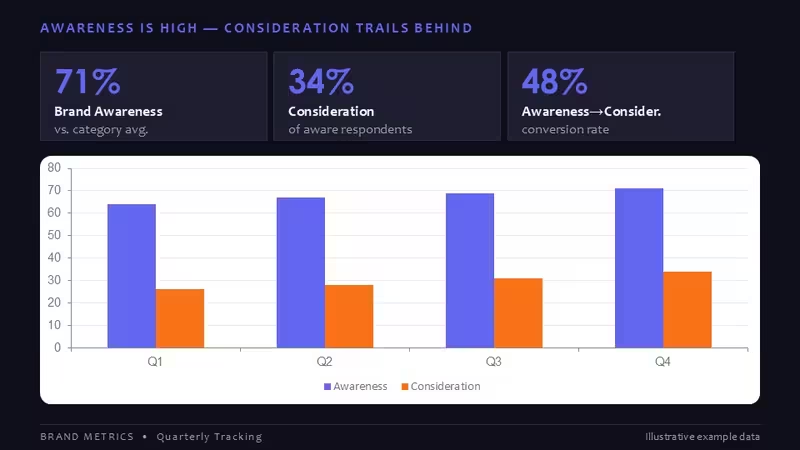
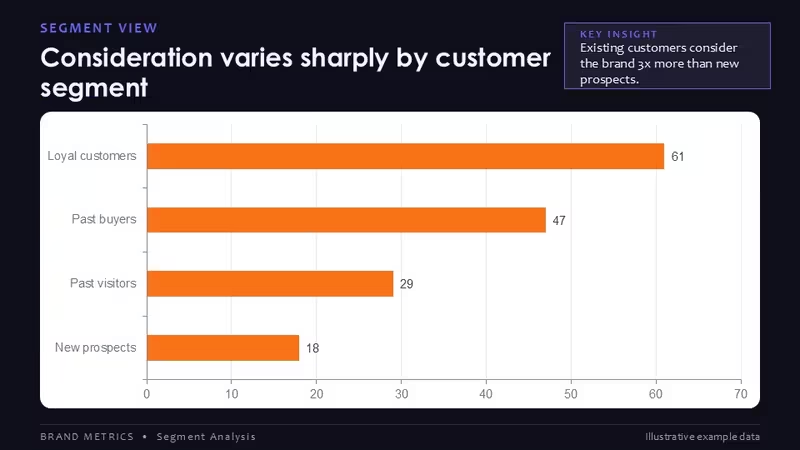
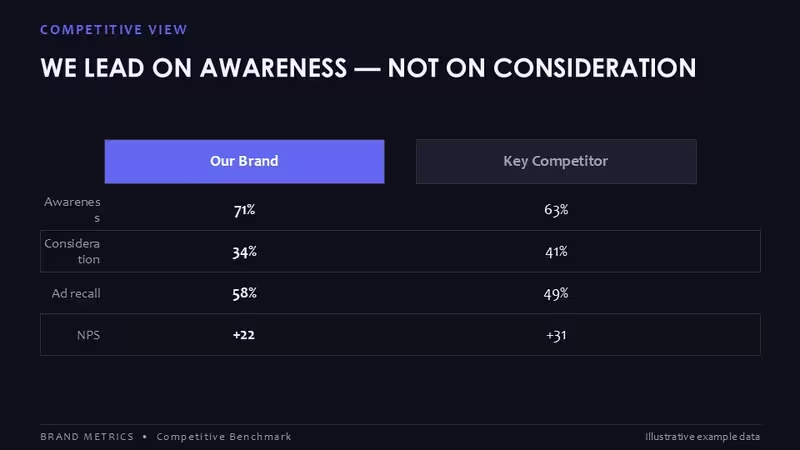
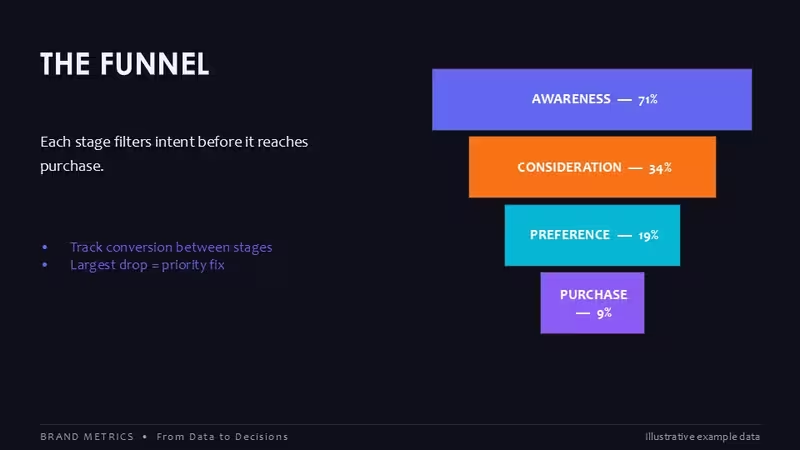
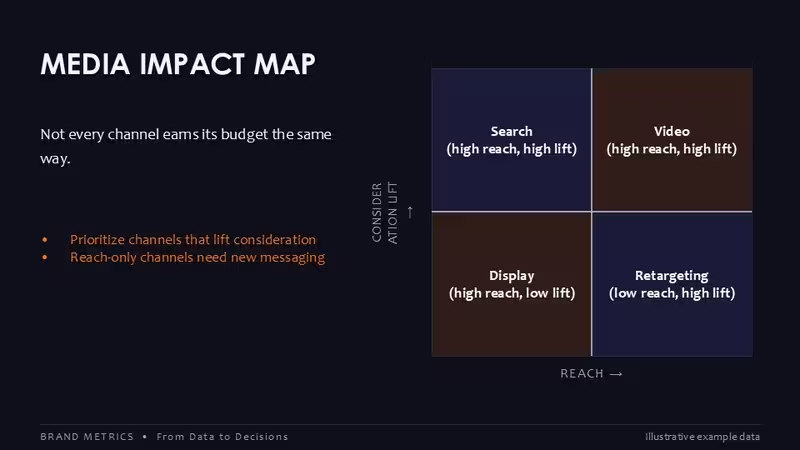
This PowerPoint template delivers 24 editable slides built around brand metrics and performance charts. Brand managers and marketing professionals use it to visualize KPIs, trend data, and comparative metrics during strategy sessions and performance reviews.
Practical Editing Behavior
Charts support direct data point editing and label updates. Vector elements allow shape recoloring and text placeholder modifications using standard PowerPoint tools.
Technical Advantages
- 24 editable slides maintain layout consistency when updating chart data.
- Native .pptx format ensures full compatibility with current PowerPoint versions.
- Structured chart layouts speed up data replacement while keeping visual alignment.
- Supports standard aspect ratio for widescreen presentations.
Frequently Asked Questions
How do I customize the charts in this template?
Replace values directly in the chart data sheets. All elements use native PowerPoint objects for easy editing of colors, labels, and styles.
Is the template suitable for brand performance reporting?
Yes. The slides focus on brand metrics visualization, making them suitable for marketing dashboards and executive updates.
Good for
- Project roadmaps and sprint plans
- Product launch timelines
- Quarterly or annual review decks
- Company history and milestone summaries
Licence
reviews
Great PowerPoint template for presenting brand metrics and KPIs. The editable charts are easy to customize, and the clean, professional design works very well for marketing presentations, business reports, and brand performance analysis. A useful presentation template for anyone working with data and visualizing marketing metrics.
FAQ
Will it work in Google Slides?
Are fonts embedded?
Can I use this for client work?
What's the refund policy?
Do you update the template after purchase?
Similar templates
See all PowerPoint Charts →
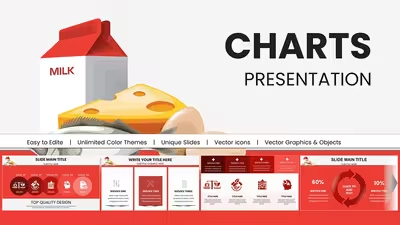
All 24 slides