 Click to zoom
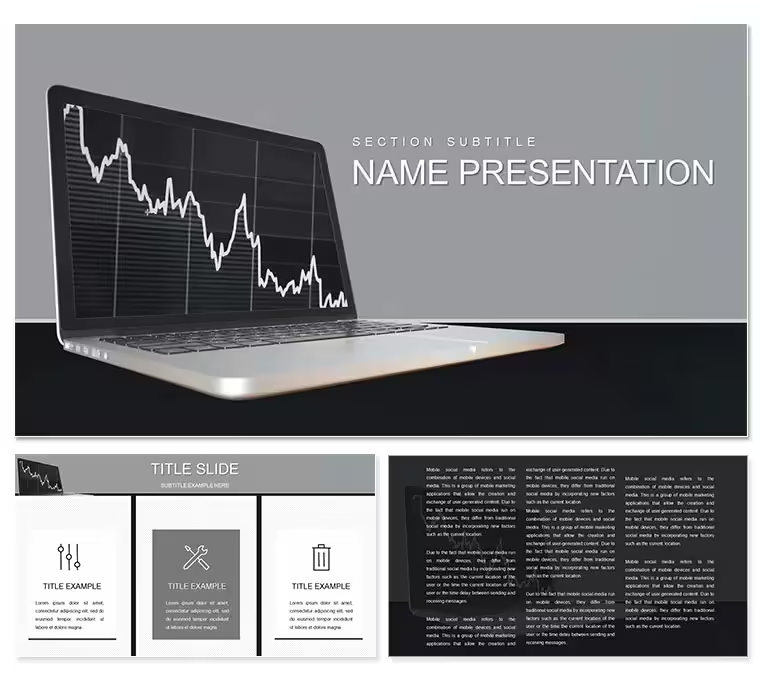
Analytics and Forecasting PowerPoint template
Available formats:
$12
one-time · commercial licence included
Buy 1 more template(s) and get 10% off your whole order Browse templates
| Format | .pptx |
| Slides | 3 unique layouts |
| Aspect ratio | 16:9 |
| Compatibility | PowerPoint |
| Animated | No |
| Language | English |
| License | Commercial |
| File size | — |
| Version | v1.0 |
| Last updated | October 2022 |
What's inside
As practice shows, a modern commercial, financial, or CEO does not have enough information about events that have already occurred (sales, cash receipts, movement of goods in warehouses) for a successful business in the near future. The main task of any project to build a system of business analysis and forecasting is the correct interpretation of analytical tools, identifying hidden patterns, and influencing factors, and, as a result - building predictable models of business processes. The downloaded Analytics and Forecasting PowerPoint template makes it easy to create a presentation.
Slides
3
downloads
40
reviews
7
Format
1
Good for
- Project roadmaps and sprint plans
- Product launch timelines
- Quarterly or annual review decks
- Company history and milestone summaries
Not a Gantt chart tool. If you need live date-driven scheduling, use MS Project or Smartsheet.
Licence
✓ Allowed
Use in internal and client presentations, modify freely, unlimited projects.
✕ Not allowed
Resale, redistribution, or use in another template product.
reviews
★★★★★
7 reviews
L
Used the predictive sales funnel diagrams for a quarterly forecast meeting, the regression analysis correlation was spot on.
R
The time series decomposition line charts were helpful, but the confidence interval error bars were missing from the bar graphs.
F
Just needed a quick visual for a budget planning session, the trend line arrows were easy to add.
Y
The seasonality index heat maps were a lifesaver for the inventory management review, the outlier detection scatter plots worked well.
H
Good for a data science deck, but the moving average smoothing curves hid too much volatility.
FAQ
Will it work in Google Slides?
Yes. After import some animations may need to be re-applied, but shape fidelity and colours are preserved.
Are fonts embedded?
The template uses Calibri (built-in) and Inter (open-source). Inter is bundled in the zip — install once and you're set.
Can I use this for client work?
Yes. The commercial licence covers unlimited client projects. The only restrictions are resale and redistribution of the template file itself.
What's the refund policy?
14-day refund if the file doesn't open or doesn't match the previews shown on this page. Contact support@imaginelayout.com with your order ID.
Do you update the template after purchase?
Yes. All future updates to this SKU are free — you'll receive an email when a new version is released.
Similar templates
See all PowerPoint Templates →
PowerPoint Templates
Marketing Planning Process PowerPoint Template: Map Out Success Stories
3 slides
·
PP03549


PowerPoint Templates
Compass: Marketing and Management PowerPoint Template - Steer Toward Success
3 slides
·
PP03669
All 1 slides