PowerPoint Templates
Pitch decks, reports, and corporate slides for every scenario.
4,030 templates available
·
Updated April 2026


PowerPoint Templates
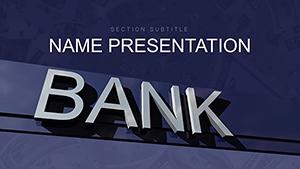
Bank Safe PowerPoint Template: Locking in Financial Fortitude
3 slides
·
PP03711
PowerPoint Templates
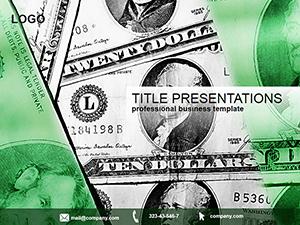
"Banking, Credit Cards, and Loans PowerPoint Template: Master Financial Dialogues"
3 slides
·
PP03555


PowerPoint Templates
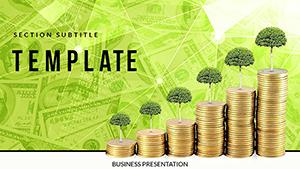
Gold Reserves Business PowerPoint Template: Mine Valuable Insights
3 slides
·
PP00589

PowerPoint Templates
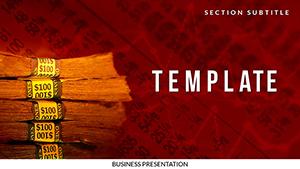
Economic Recession PowerPoint Template: Steady in the Squall
3 slides
·
PP00834

PowerPoint Templates
Economics Major PowerPoint Template: Visualize Social and Financial Dynamics
3 slides
·
PP03137

PowerPoint Templates
Coin Bitcoin Business PowerPoint Template: Chart the Future of Digital Currency
3 slides
·
PP01289


PowerPoint Templates
Professional Credit Card PowerPoint Template: Ignite Your Business Narratives
3 slides
·
PP03556