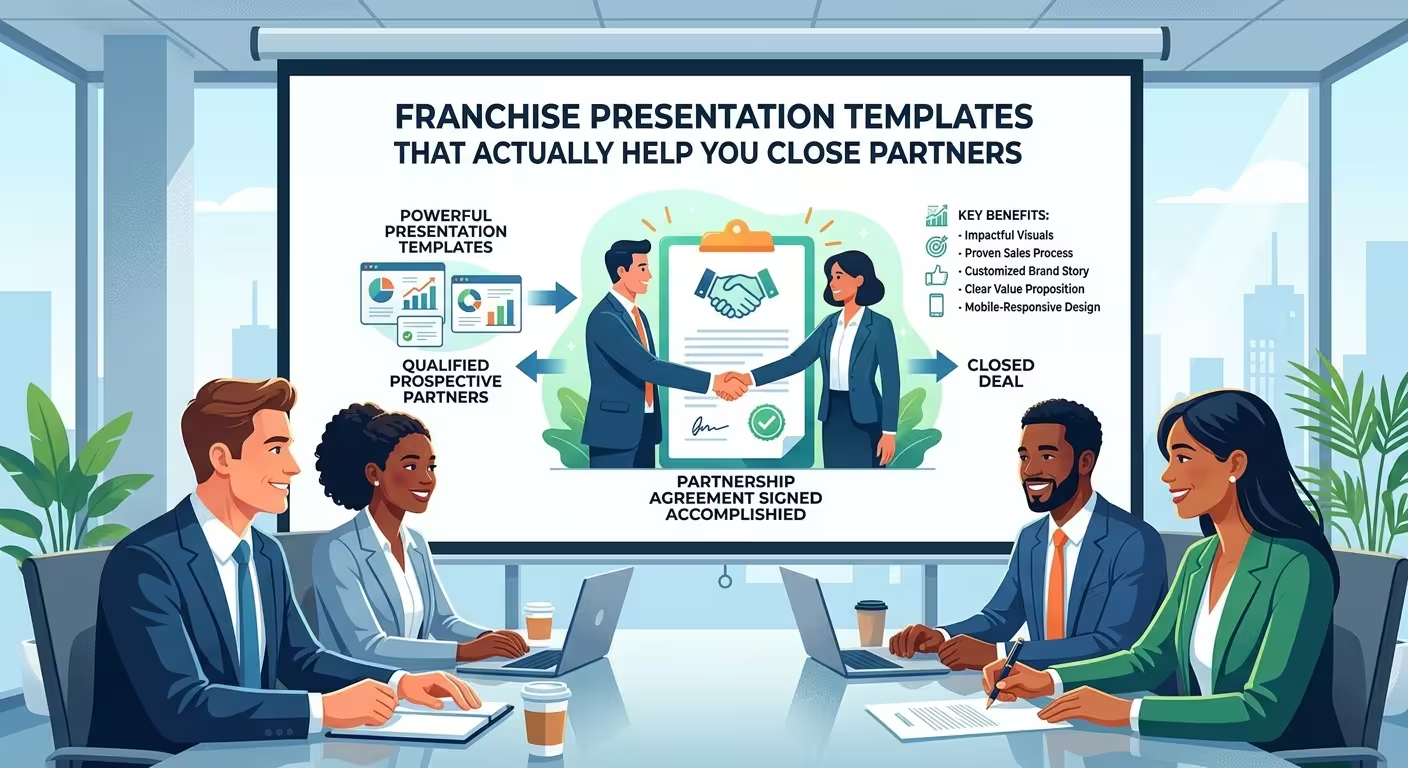
A franchisor I'll call typical here — because the pattern shows up across categories, not just one brand — handed their development team a deck built by the same agency that made their investor pitch a year earlier. Same tone, same "massive market opportunity" slide, same hockey-stick chart. It didn't close a single discovery day for two quarters. The problem wasn't the design. It was the audience: an investor is buying equity upside, a franchisee is buying a system they'll operate themselves for the next decade. Those are different pitches wearing the same slides.
The Deck's Job Changes Depending on Where the Prospect Is
Franchise development teams that track their funnel closely report different closing behavior at every stage, and the gap between them is bigger than most people assume. According to Franchise Update Media's Annual Franchise Development Report, discovery-day-to-sale close rates climbed to roughly 75% in the most recent survey year, up from around 65% two years earlier — while overall application-to-sale ratios sit closer to 32%. That's not a small gap. It means the deck a prospect sees before they apply is doing fundamentally different work than the one presented at discovery day.
A template built to move someone from cold interest to application needs to answer "is this worth my time to investigate" — fast, low-commitment, mostly credibility and category fit. A discovery-day template is talking to someone who already cleared financial pre-qualification and flew out. That person doesn't need convincing the category is real. They need the specific, sometimes uncomfortable detail that lets them picture running the unit themselves.
Where Most Templates Quietly Undersell the Economics Slide
Here's the part that trips up even experienced development teams: the instinct is to show upside. Average unit volume, best-performing locations, growth trajectory. It reads well in the room. It also reads as marketing to anyone who has sat through more than one franchise pitch — and by discovery day, most candidates have.
What actually builds trust is showing the range, not just the peak. Item 19 disclosure data broken into quartiles — top performers, median, bottom quartile — with an honest note about what separates them (location, operator experience, local competition) does more to close a serious candidate than a single glowing average ever will. It complicates the pitch in the room, which is exactly why it works: a prospect who sees you acknowledge the bottom quartile trusts the top-quartile number more, not less.
This is also where chart choice actually matters instead of being a cosmetic afterthought. A funnel visual that maps lead → qualified lead → application → discovery day → close, with your own numbers dropped in, tends to land harder than a narrative slide saying "we have a strong pipeline." It's the same instinct behind a good sales funnel chart template — the structure does the persuading, not the copy around it.
The Slide Order That Survives a Skeptical Operator
I'd push back on the standard "brand story first" advice that shows up in most franchise template guides. It's not wrong, exactly — it's just aimed at the wrong moment in the funnel. Brand story earns its place early, when you're trying to get someone to apply. By discovery day, the sequence that actually holds up looks closer to: operating model → unit economics range → support and training structure → territory and timeline → the specific commitment being asked for.
That last part — being specific about the ask — is where franchise decks and fundraising decks converge, even though the audiences differ. The same discipline that makes a good pitch deck actually get funded applies here: vague asks read as unprepared, and over-engineered ones read as rigid before there's been a real conversation. A franchise deck that says "here's the territory available, here's the investment range, here's what happens in the next 30 days" earns more trust than one that circles the commitment without naming it.
Design Discipline Isn't Optional Once the Deck Gets Technical
Franchise decks accumulate slides fast — legal disclosures, unit economics, training timelines, territory maps — and the temptation is to cram detail onto fewer slides to "keep it tight." That backfires here more than almost anywhere else, because a prospective franchisee reading a dense economics slide while you're talking is doing math instead of listening to your answer to their last question.
The same principle behind good slide design discipline applies with extra weight in a franchise context: if a number needs to be studied rather than glanced at, it belongs on its own slide with room to breathe, not folded into a paragraph of legal-adjacent text. A territory map with one clear callout beats a map crowded with every open market at once — the prospect isn't evaluating your whole system yet, just whether there's a place for them in it.
What This Actually Changes About Choosing a Template
The practical takeaway isn't "buy a fancier template." It's building — or choosing — two related but distinct decks instead of stretching one across the whole funnel: a shorter, brand-forward version for the early application stage, and a denser, economics-heavy version built specifically for discovery day, where the questions get harder and the polish matters less than the honesty of the numbers.
If you're revising a franchise deck right now, the fastest diagnostic is this: pull up your economics slide and ask whether it would survive being read by someone who already talked to three of your existing franchisees. If it wouldn't, that's the slide to fix before touching anything else.
Comments (0)