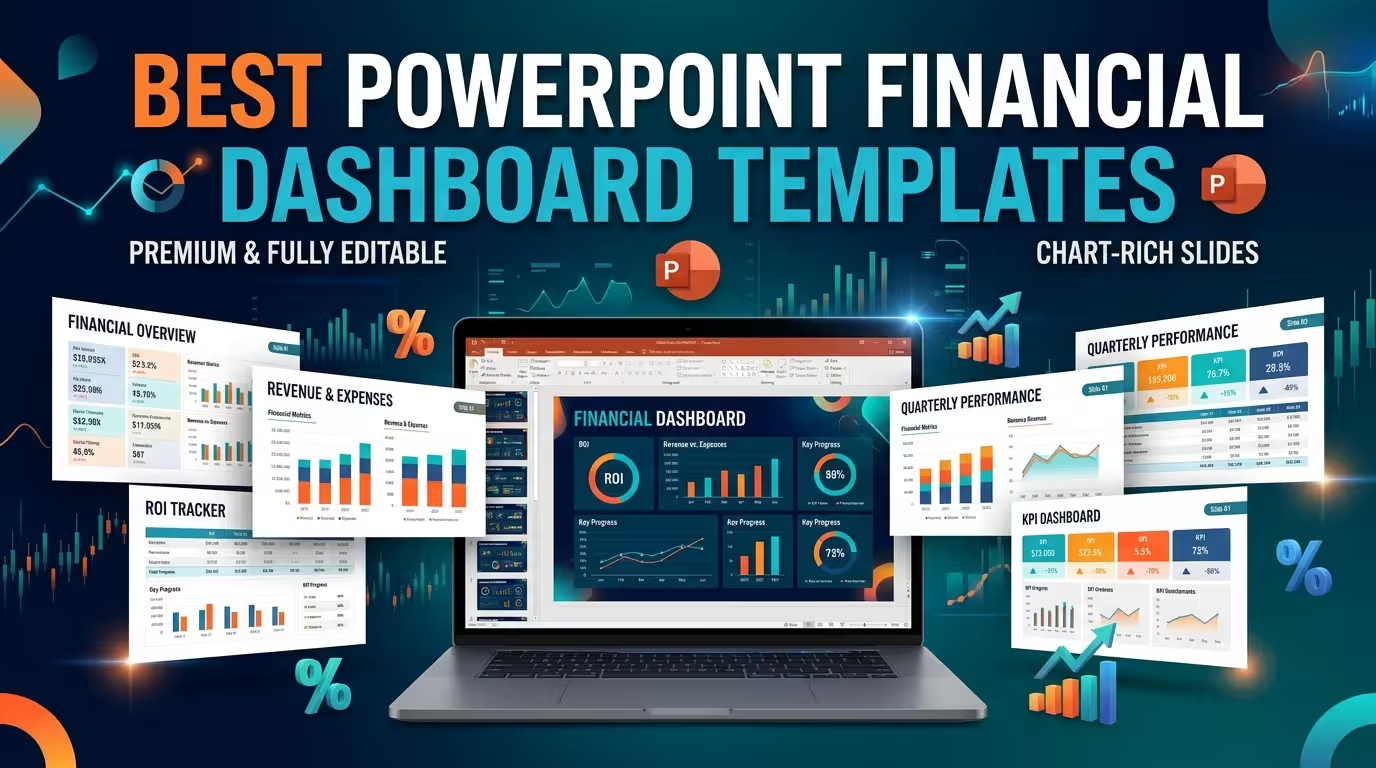
What Makes a Financial Dashboard Template Useful?
A financial dashboard has one job that ordinary presentation slides often struggle with: putting several important numbers into one visual system without making the audience hunt for them.
That makes the choice of template more important than it first appears. A dashboard designed for startup KPIs is not necessarily the right choice for a department budget review, just as a financial-reporting layout may be too detailed for a five-minute executive update.
On ImagineLayout, financial PowerPoint templates cover several different presentation needs, including KPI dashboards, financial charts, startup financial models, budget analysis, and financial reporting. The right option depends on the story behind the numbers.
1. Financial KPI Dashboard Template
If your presentation needs a concentrated view of business performance, the Financial KPI Dashboard Template is built specifically around that requirement.
The template contains 24 unique PowerPoint layouts and is designed as an editable PPTX file. Its dashboard-oriented structure makes it suitable when the audience needs to see several financial indicators together rather than study one chart at a time.
This type of dashboard works particularly well for:
- Executive financial reviews
- Monthly or quarterly KPI presentations
- Management reporting
- Business performance updates
- Financial presentations where several indicators need to be compared
The important advantage of a KPI dashboard is the ability to establish a visual hierarchy between metrics. Instead of giving every figure equal space, you can make the metrics that drive the discussion more prominent.
ImagineLayout lists this template as a 24-slide editable PPTX compatible with PowerPoint, with a 16:9-style widescreen aspect ratio.
2. Financial Charts Presentation for Deeper Analysis
A dashboard answers “How are we performing?” A financial charts presentation can go one step further and explain why the numbers look the way they do.
The Financial Charts Presentation contains 45 unique layouts and combines financial storytelling with comparison tables, KPI dashboards, process flows, and valuation-oriented diagrams.
This makes it a useful option when a presentation needs to move beyond a collection of headline numbers. For example, a finance team might begin with a KPI overview, move into a comparison, explain the relationship between EBITDA and net profit, and then use additional charts to support the discussion.
The template is particularly relevant for:
- Financial analysis presentations
- Investor preparation
- Finance training
- Metric explanations
- Consulting presentations
ImagineLayout lists 45 slides, editable text, shapes, charts, and labels, plus centralized master controls for repeated visual elements. The page also states that the file is supplied in PPTX format and uses a 16:9 widescreen layout.
3. Startup Financial Model Dashboard
Startup finance requires a different dashboard logic because investors and founders often need to see operational KPIs alongside financial projections.
The Startup Financial Model PowerPoint Template combines financial projections with areas such as revenue, unit economics, cash flow, funding, scenarios, and KPI reporting.
The KPI dashboard section is particularly relevant for presentations where metrics such as MRR, ARR, churn, and customer counts need to appear together. The template also includes layouts for revenue projections, P&L information, unit economics, and scenario analysis.
This type of dashboard is a better structural match when the audience is interested not only in current performance but also in the financial model behind future growth.
ImagineLayout lists 32 unique layouts for this template and describes it as a 16:9 widescreen PPTX presentation designed for PowerPoint.
4. Department Budget Analysis Dashboard
Budget presentations create a different problem: the audience often needs to compare planned spending with actual results across several departments or categories.
The Department Budget Analysis template focuses on allocation, variance tracking, ROI reporting, forecasting, and longer-range financial planning.
Its layouts include KPI dashboards, planned-versus-actual analysis, allocation charts, forecasting views, and executive-summary formats. That combination makes it useful when the financial story depends on comparisons rather than one isolated KPI.
A budget dashboard becomes much easier to interpret when related numbers stay together. For example, planned spending, actual spending, and variance can be presented as one analytical block rather than scattered across separate slides.
ImagineLayout lists 43 unique layouts in the current PPTX version and identifies PowerPoint compatibility and a widescreen aspect ratio.
5. Department Budget Comparison PowerPoint Template
Sometimes the challenge is not showing one department's budget but comparing several of them on the same slide.
The Department Budget Comparison PowerPoint Template is designed around annual financial comparisons and includes layouts for stacked bars, variance waterfalls, grouped columns, and summary dashboards.
This approach is useful when management needs to compare departments without moving through a separate slide for every cost center.
The key design decision here is to compare like with like. If every department uses the same metric order and visual structure, the audience can move across the dashboard and identify differences without relearning the chart on every section.
The ImagineLayout page lists 30 unique editable layouts for this template.
6. Financial Report PowerPoint Diagrams
Not every financial presentation needs a traditional dashboard made from KPI cards. Some reports are easier to understand when relationships between numbers are visualized through diagrams.
The Financial Report PowerPoint Diagrams collection provides 13 editable layouts for turning financial information into presentation-ready visual structures.
This approach can be useful for quarterly reports, board presentations, investor updates, or situations where the audience needs to understand relationships rather than simply read a table of figures.
The template supports PowerPoint and Keynote and uses a 16:9 format. ImagineLayout describes its diagrams as fully editable, allowing elements such as shapes, charts, and labels to be modified.
How to Choose the Right Financial Dashboard Template
The easiest way to choose is to start with the financial question your audience needs answered.
- “What are our most important KPIs?” — Start with a financial KPI dashboard.
- “Why did the numbers change?” — Use a financial charts or analysis-oriented presentation.
- “How is the startup performing and where is it going?” — Use a startup financial model dashboard.
- “Where is the budget going?” — Use a department budget analysis layout.
- “Which departments are performing differently?” — Use a department budget comparison template.
- “How do these financial concepts relate?” — Consider financial report diagrams.
This approach prevents a common mistake: selecting a template because the preview looks attractive and only afterward trying to force your data into its structure.
What to Put on a Financial Dashboard Slide
A useful dashboard does not need every available financial metric. It needs the metrics that support the decision or discussion taking place in the presentation.
Depending on the purpose of the deck, a financial dashboard may include:
- Revenue
- Operating expenses
- Profit or net income
- Cash flow
- Budget versus actual results
- Growth indicators
- Key operational KPIs
- Forecast figures
- Variance indicators
The exact combination should change according to the audience. A CFO reviewing financial performance may need a different dashboard from a founder preparing an investor presentation or a department manager reviewing an annual budget.
One practical test is to remove one metric at a time. If removing a number does not change the discussion or decision, it may not deserve prime space on the dashboard.
Why Editable PowerPoint Templates Matter for Financial Dashboards
Financial information changes frequently. A dashboard that looks correct today may need new revenue figures, revised forecasts, updated KPI values, or a different comparison period tomorrow.
That is why editability matters more than a static image when the dashboard is part of an ongoing reporting process.
The ImagineLayout financial templates are provided as editable PowerPoint files, allowing users to modify text, shapes, charts, labels, and other presentation elements depending on the template. For example, the Financial KPI Dashboard is supplied as an editable PPTX, while the Financial Charts Presentation provides editable charts, shapes, and labels.
For recurring reporting, it is also useful to establish a consistent structure: keep the same position for major KPIs, preserve the meaning of colors, and update the reporting period without redesigning the entire slide.
Build the Dashboard Around the Financial Decision
The best financial dashboard template is not necessarily the one with the most slides or the most charts. It is the one whose structure matches the financial question your presentation needs to answer.
For a compact KPI review, a dedicated financial KPI dashboard is a logical starting point. For deeper analysis, a financial charts presentation gives you more room to explain relationships and comparisons. Startup teams can use a financial model structure that connects KPIs with projections, while finance teams comparing spending can work more effectively with budget-analysis layouts.
Before choosing a template, write down the three to five financial questions your audience is most likely to ask. Then choose the dashboard structure that answers those questions with the least unnecessary movement between slides. That small step usually matters more than choosing between one visual style and another.
Comments (0)