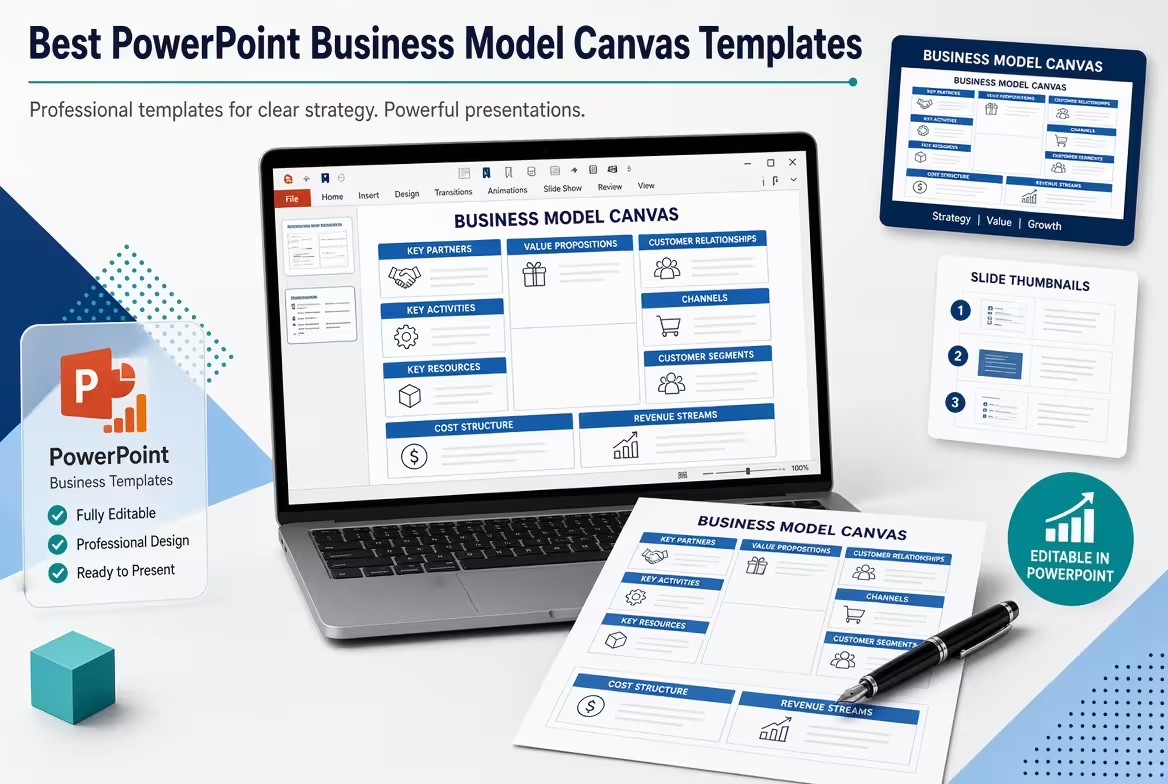
A Business Model Canvas looks simple until you have to present one to people who did not build it. Nine blocks, dozens of assumptions, and one slide can quickly become either too dense to read or too vague to be useful. The right PowerPoint template is therefore not just a matter of appearance — it determines how much of the business model your audience can understand at once.
This guide compares practical Business Model Canvas and related strategy templates from ImagineLayout, with a focus on what each type is actually good at: presenting the complete canvas, expanding it into a business-plan story, or showing relationships between strategic components.
What makes a Business Model Canvas template useful in PowerPoint?
The basic Business Model Canvas has a fixed logic: customer-facing elements sit opposite the operational infrastructure, while the financial side connects the model through revenue and cost structure. That fixed architecture is useful because the audience already has a mental map of it.
The problem begins when a template adds visual decoration without respecting that architecture. A canvas can look polished and still become harder to discuss because the eye no longer knows which blocks belong together.
For PowerPoint, I would judge a Business Model Canvas template against four practical questions:
- Can the complete model be understood on one slide?
- Can individual blocks be expanded when the audience needs more detail?
- Can the visual hierarchy distinguish assumptions from established facts?
- Can the canvas be adapted to the rest of the presentation without rebuilding it?
That last point is easy to overlook. A canvas is often only one part of a larger strategy deck. If its typography, proportions, and visual language cannot coexist with the surrounding slides, you end up with a good-looking diagram that feels imported from another presentation.
Best for a complete canvas overview: Business Model Canvas Keynote / PowerPoint Charts
When the audience needs to see the entire business model at once, the most direct solution is a dedicated canvas layout rather than a general business presentation template.
Business Model Canvas Keynote - Fully Editable from ImagineLayout is particularly relevant because the page lists PowerPoint Charts as an available format and provides 12 editable canvas layouts in a 16:9 format. The structure uses fixed modular blocks for the standard canvas sections, so the geometry does not have to be rebuilt every time the model changes.
The practical advantage is not simply that the nine blocks are already drawn. It is that the same structure can be reused across several versions of a model. A consultant can duplicate a slide for different scenarios, while a founder can maintain one version for an internal workshop and another for an investor discussion without changing the underlying geometry.
The template also uses editable slide-master color controls, which matters when the canvas has to inherit an existing presentation's brand system. Changing the palette at the master level is more reliable than recoloring individual boxes one by one.
There is a limitation: the canvas format is deliberately structured. It is useful when the model itself is the object of discussion, but it is not a substitute for a more narrative product or investor presentation. If the meeting is primarily about a product demonstration, putting nine equal-weight blocks on the screen may actually distract from the story.
When one canvas slide is not enough
A common mistake is to make the Business Model Canvas carry information it was never designed to carry.
Suppose a strategy meeting starts with the canvas but then moves into market assumptions, financial projections, operational dependencies, and implementation. Keeping everything inside the original nine-block grid forces too much information into boxes that were intended to summarize, not explain.
This is where a broader business-plan template becomes more useful.
Business Plan PowerPoint Charts from ImagineLayout contains 27 editable layouts covering areas such as executive summaries, financial projections, market analysis, and other business-plan frameworks. It is available as a PowerPoint .pptx and uses a 16:9 format.
This type of template works well when the canvas is the starting point rather than the final slide. You can introduce the business model, then move into the evidence behind particular blocks instead of squeezing that evidence into the canvas itself.
For example, a Revenue Streams block might contain only the essential monetization logic. A later financial slide can then show the assumptions, projections, or scenario structure behind it. The separation makes both slides easier to read because each has a different job.
That is an important distinction when choosing a template: a good canvas slide summarizes a model; a good strategy deck explains why the model makes sense.
Best when relationships matter more than the nine boxes
Sometimes the audience already understands the canvas. What they do not understand is how its parts influence one another.
For that situation, a relationship-oriented diagram can communicate more than another static canvas.
Interrelationships Between Factors Keynote Charts includes editable diagrams for mapping connections, directional relationships, tree structures, and business-model visuals. The page describes 18 layouts and specifically includes business model canvas applications among the deeper diagram slides.
This is useful when the question changes from “What are the nine parts of our model?” to “What happens if this part changes?”
Consider a hypothetical subscription business. A change in customer segment could affect the value proposition, acquisition channel, support model, and ultimately the cost structure. A traditional canvas records these components, but a relationship diagram can make the dependency itself visible.
That distinction is particularly useful in strategy reviews. A canvas is a map of the model. A relationship diagram can become a map of the model's dependencies.
Use a strategy framework when the canvas leads to a competitive decision
There is another point where a Business Model Canvas can stop being the right central visual: when the discussion has moved from describing the model to deciding how it should compete.
Imagine a team has already mapped customers, partners, activities, resources, channels, costs, and revenues. The next question may be whether the business should compete through lower price, differentiation, or another strategic position.
In that situation, Bowmans Strategy Clock PowerPoint Template provides a different type of strategic visual. ImagineLayout describes it as a 24-slide editable PowerPoint Charts template built around the Strategy Clock, which maps competitive positions using price and perceived value.
It should not replace the Business Model Canvas. It answers a different question.
The useful workflow is to let the canvas establish how the business works, then use a competitive framework to discuss where the business intends to position itself. Mixing those two questions into one diagram usually creates a slide that is technically comprehensive but difficult to present.
How to choose the right PowerPoint canvas format
Instead of asking which template looks best in isolation, start with the meeting.
- Strategy workshop: use a dedicated canvas layout where all nine components remain visible and easy to edit.
- Investor or management presentation: use the canvas as an overview, then expand the important assumptions on dedicated business-plan slides.
- Business-model analysis: add relationship diagrams when dependencies between blocks are the real subject.
- Competitive strategy discussion: move from the canvas into a framework such as a strategy-positioning diagram rather than forcing competitive analysis into the nine-block grid.
The choice also depends on how much of the canvas is actually changing. If only one or two assumptions are being discussed, a full canvas may be unnecessary. A focused slide showing the affected customer segment, value proposition, and revenue logic can make the change easier to understand.
Conversely, if the audience is reviewing the entire business model for the first time, splitting the canvas across several slides too early can remove the very advantage of the framework: seeing the system as a whole.
The most useful canvas is the one that survives the next slide
A Business Model Canvas is rarely the end of a presentation. It usually sits somewhere in the middle: after the problem and before the evidence, financials, strategy, or implementation plan.
That is why the strongest PowerPoint template is not necessarily the one with the most elaborate graphics. It is the one that gives you a clean canvas when you need the overview, enough flexibility to expand the important blocks, and a visual language that can continue into the rest of the deck.
For a straightforward canvas-first presentation, the dedicated Business Model Canvas template is the natural starting point. When the presentation needs to explain the broader business plan, the Business Plan PowerPoint Charts provide a wider framework. When the real issue is how strategic elements interact, the Interrelationships Between Factors charts can carry that explanation further.
The key is to stop treating the Business Model Canvas as a single decorative slide. Used properly, it is an overview layer — a compact model that tells the audience where to look next.
Comments (0)