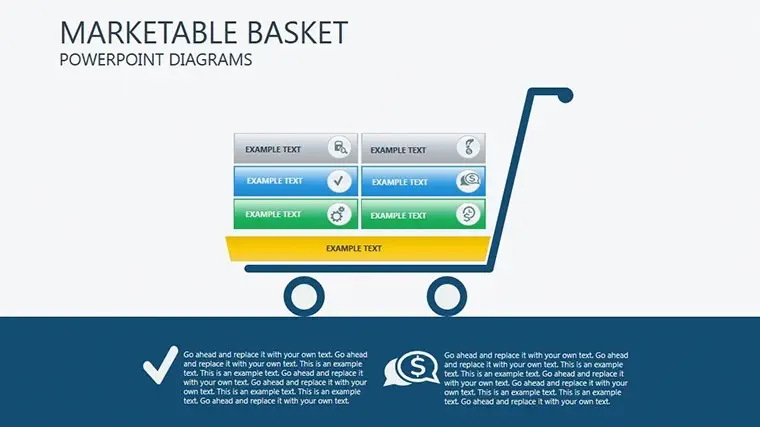
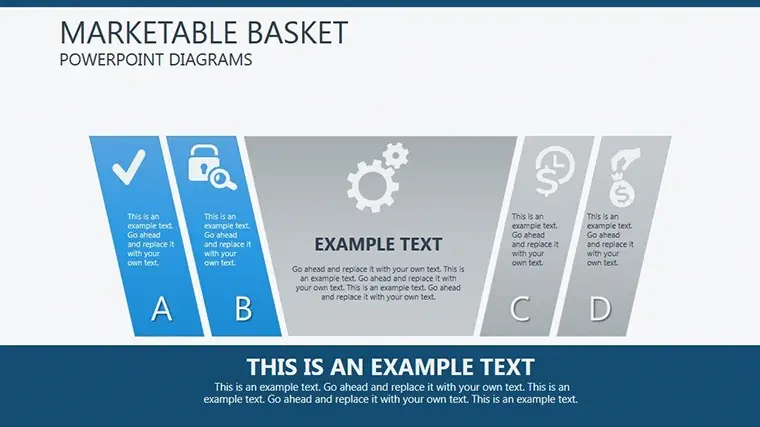
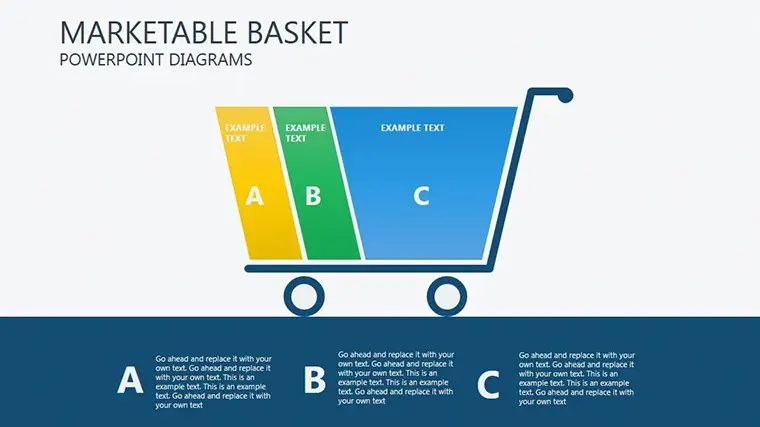
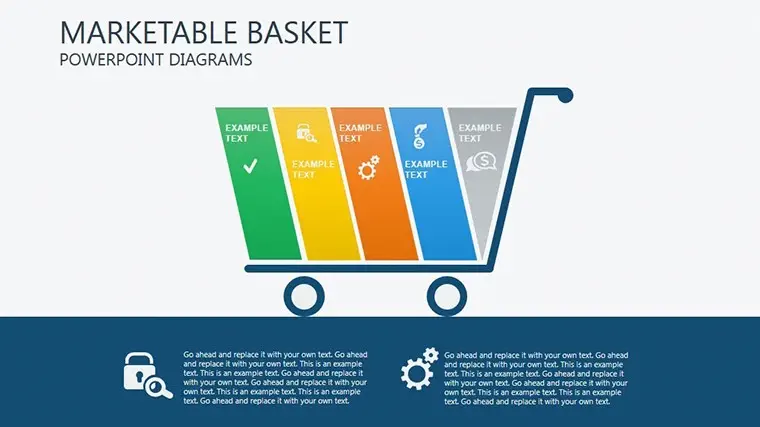
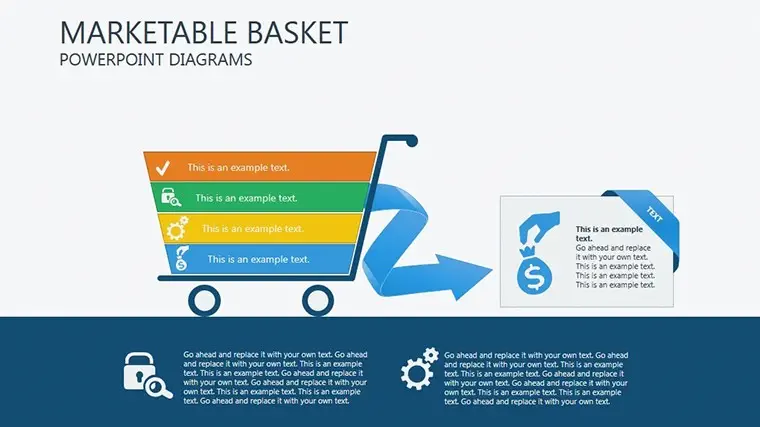
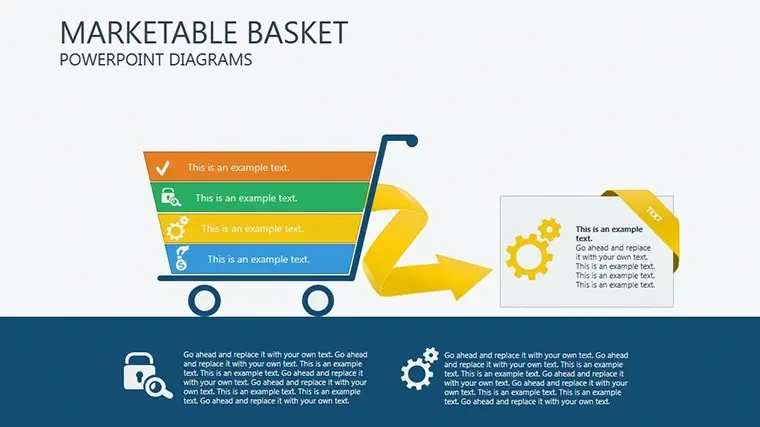
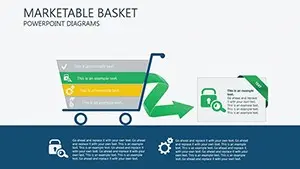
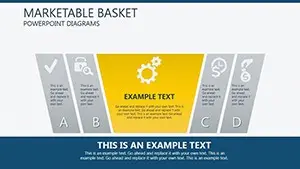
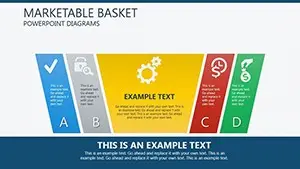
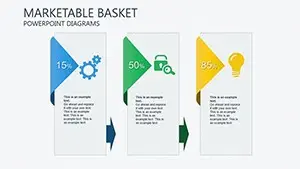
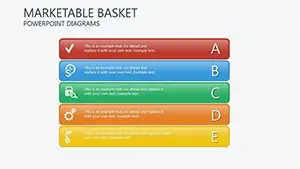
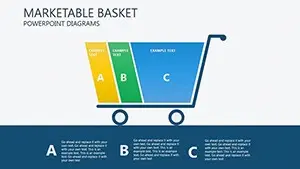
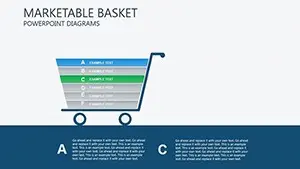
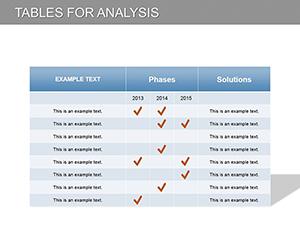
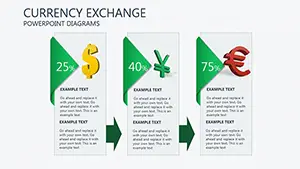
In nested template ready and editable PowerPoint Diagrams that define the method fixed set of rates and the level of the minimum consumer basket relative to the average level of income (expenses). In Marketable Basket PowerPoint Diagrams, you can add a set of food, services, and other factors. Unique Custom Slides with Color Full Variations, Custom Animated effects,
.potx, vector icons, and JPG included in files.
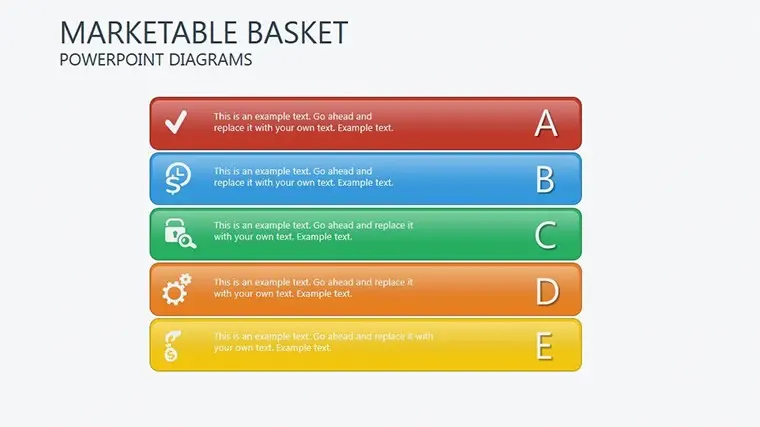
1) Wide functionality to create high-quality and attractive animations.
2) High-quality images and inscriptions.
3) Fully Easy to change colors, and text.
4) Fully editable.
5) Expanding opportunities (work with text and images, the ability to insert video and audio fragments, animations)
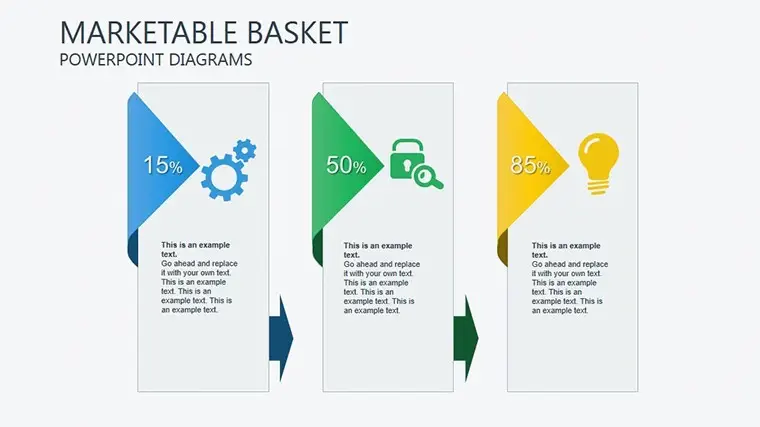
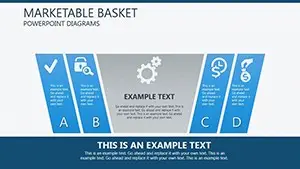
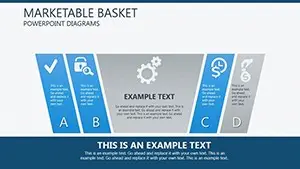
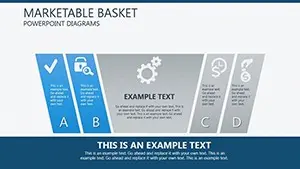
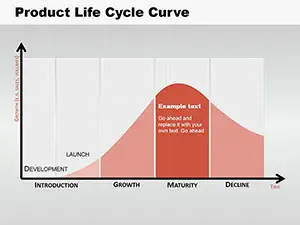
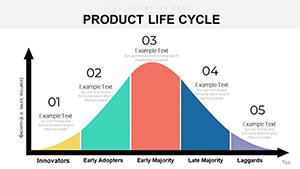
Graphically the dependence of a value from another. Using Marketable Basket diagrams the relationship between the data becomes clear. Diagrams facilitate the comparison of different data. The created presentation will be played on almost any computer.
Related Templates
ID: #PD00105
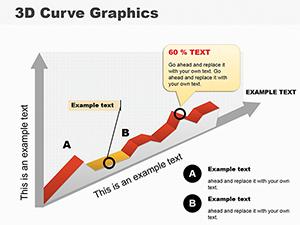
3D Curve Graphics PowerPoint Diagrams for Presentations
ID: #PD00104
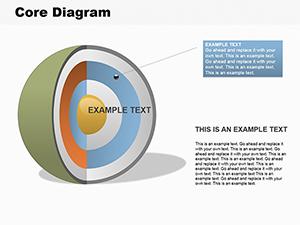
Core Spherical PowerPoint diagrams
ID: #PD00101
Product Life Cycle Curve PowerPoint Diagrams | Download Templates