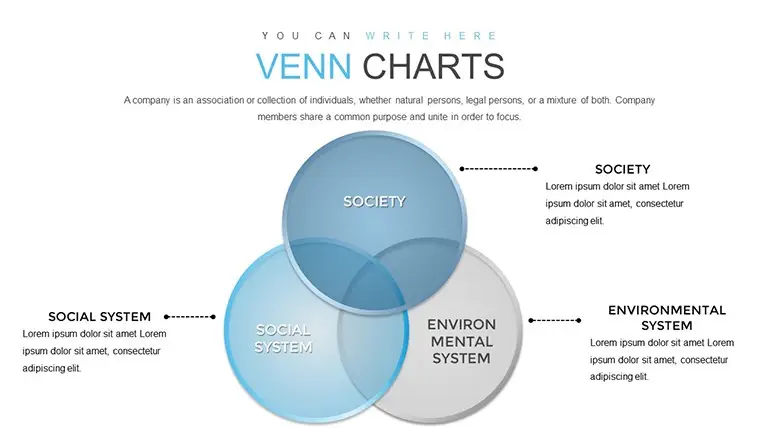
Venn Problem Solving Keynote charts a ready-made tool that will help you visualize the relationships between subsets for a visual image. This chart is used in mathematics, logic, management, and other applications. Download the Venn Problem Solving chart for the Keynote presentation here!
The advantage of Venn Problem Solving charts is that they provide clear statistical information, they allow you to quickly make a logical conclusion from a large amount of obtained data. They are the basis for subsequent analysis or for the preparation of a statistical report.
The graphical representation of the Keynote chart allows you to control the reliability of the data obtained.
Related Templates
ID: #KC00295
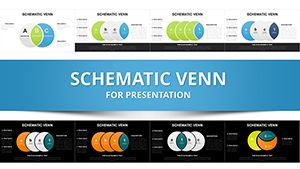
Schematic Venn Keynote charts template
ID: #KC00786
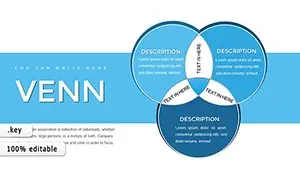
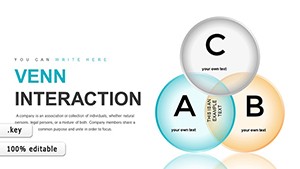
Venn Charts in Keynote presentation
ID: #KC00787
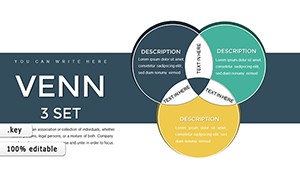
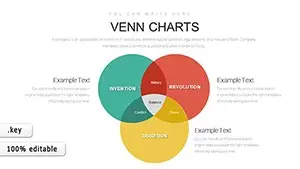
Venn - 3 Set Keynote charts
ID: #KC00789
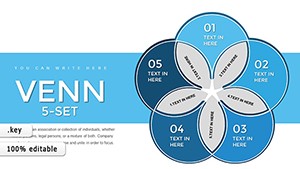
Venn - 5 Set Keynote charts
ID: #KC00871
Graphic Venn Keynote charts
ID: #KC00885
Venn Collection Keynote Charts
ID: #KC00788
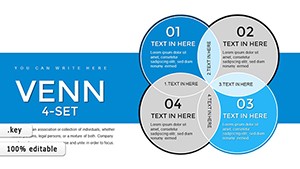
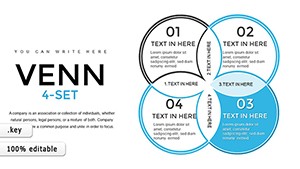
4-Set Venn Keynote Charts Template for Presentation