 点击放大
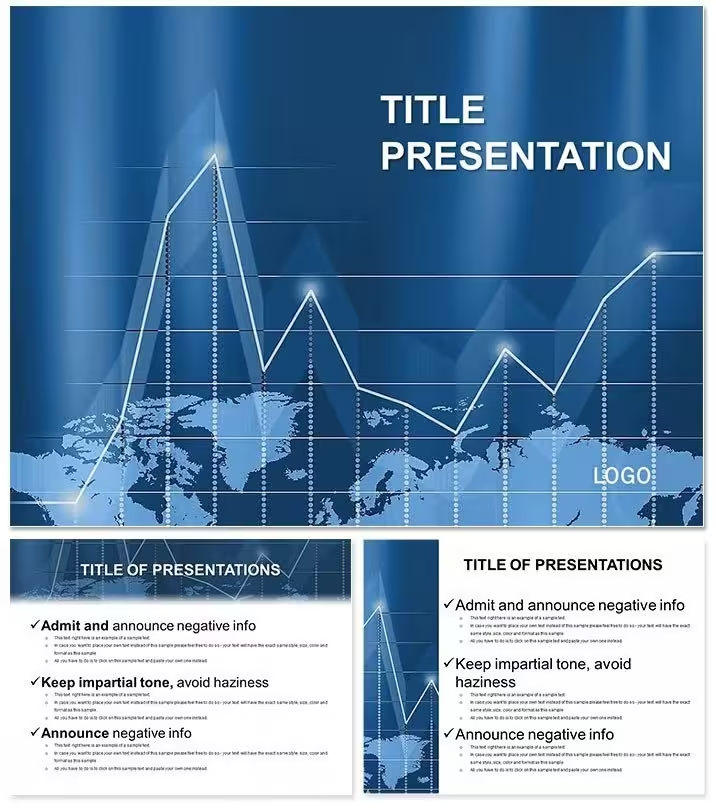
基本市场分析 PowerPoint 模板 – 可编辑图表 | 即时下载
| 格式 | .pptx |
| 幻灯片 | 3 个独特版式 |
| 宽高比 | 16:9 |
| 兼容性 | PowerPoint |
| 动画 | 否 |
| 语言 | English |
| 授权 | Commercial |
| 文件大小 | — |
| 版本 | v1.0 |
| 最后更新 | 2026年9月 |
内含什么
在 PowerPoint 中打开 .pptx 文件。所有 28 个图表均可完全编辑,点击元素以修改文本、数据或形状。通过一键选择任一 7 种色彩方案进行即时品牌更新。根据需要调整大小或重新排列组件。可编辑结构支持快速集成您的市场数据,同时保持基础分析布局不变。大多数用户在 25 分钟内完成自定义。
需要哪些软件?模板与页面上标注的 PowerPoint 兼容,并以 .pptx 格式提供。它在 PowerPoint 的桌面版和在线版中均可正常使用,所有图表和色彩方案完好无损。
包含多少个图表?在 7 种色彩方案下,产品页面列出的共有 28 个图表,为市场分析演示提供全面覆盖。
可以更改颜色以匹配品牌吗?是的,7 种色彩方案允许您瞬间切换以匹配企业色彩调板。在 PowerPoint 中选择方案时,所有图表将一致更新,保持基础分析视觉专业且符合品牌风格。
我将获得哪种文件格式?您将获得一个单独的 .pptx 文件,包含完整的 28 个图表和 7 种色彩方案。该格式为 PowerPoint 本地格式,支持完全编辑。
此模板适用于投资者演示吗?是的,基础市场分析的重点和清晰的可编辑图表使其非常适合投资者沟通、董事会更新和战略会议。专业结构有助于清晰地向金融受众传达复杂的市场数据。
适用场景
- 项目路线图和冲刺计划
- 产品发布时间线
- 季度或年度总结汇报
- 公司发展历程和里程碑总结
许可
条评价
Presented a quarterly market fundamentals report to the investment committee, the valuation metrics and trend diagrams made the complex data digestible.
The corporate color schemes are safe, but the diagrams are very standard finance; I felt like I was using a generic Bloomberg terminal export.
The competitive landscape and growth driver displays helped my consulting client approve the recommended entry strategy quickly.
I used it for an internal board update, the 28 diagrams made the manufacturing data accessible to the non-finance executives in the room.
It is a reliable set of fundamental analysis tools, the .pptx format opened easily, but I wish there were more specific 'sector' focuses rather than broad market themes.
常见问题
可以在 Google 幻灯片中使用吗?
字体是否已嵌入?
可以用于客户项目吗?
退款政策是什么?
购买后模板会更新吗?




全部 1 张幻灯片