 点击放大
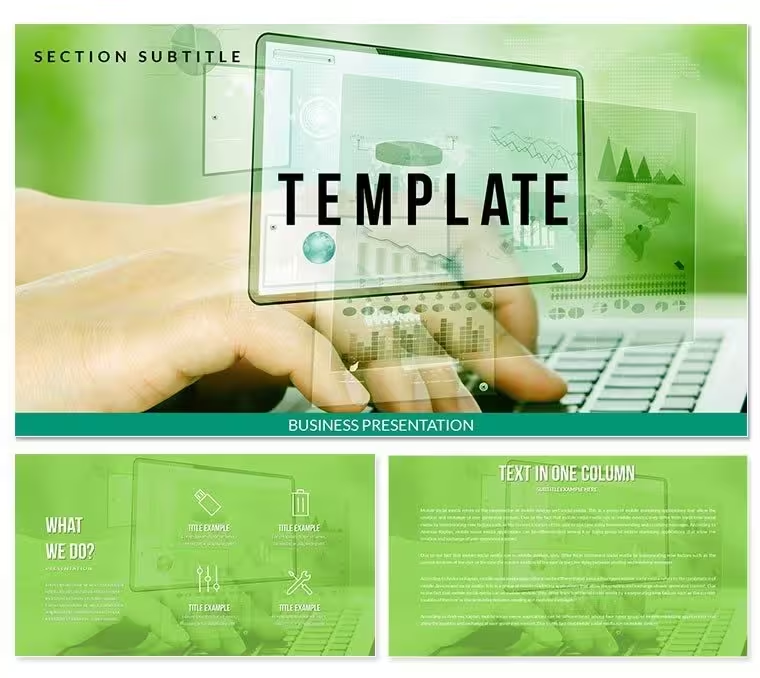
数据分析报告 PowerPoint 模板
可用格式:
$12
一次性付款 · 含商业授权
再购买 1 个模板,整单立减 10% 浏览模板
| 格式 | .pptx |
| 幻灯片 | 3 个独特版式 |
| 宽高比 | 16:9 |
| 兼容性 | PowerPoint |
| 动画 | 否 |
| 语言 | English |
| 授权 | Commercial |
| 文件大小 | — |
| 版本 | v1.0 |
| 最后更新 | 2026年8月 |
内含什么
精美数据分析报告 **PowerPoint** 模板,包含丰富颜色变体、定制动画效果、.potx 文件、矢量图标及 JPG 图片。
---
数据分析报告模板设计是一种公司展示风格,能够清晰展示行动方向并传达关键理念。在 **PowerPoint** 演示页中,整合所有相关商业财务信息,帮助突出重点,适合报告主题需求。这将提升您在客户眼中的专业形象。
幻灯片
3
下载
143
条评价
32
格式
1
适用场景
- 项目路线图和冲刺计划
- 产品发布时间线
- 季度或年度总结汇报
- 公司发展历程和里程碑总结
这不是甘特图工具。 如需基于日期的实时排期,请使用 MS Project 或 Smartsheet。
许可
✓ 允许
可用于内部和客户演示,可自由修改,项目数量不限。 ✕ 不允许
转售、再分发,或用于其他模板产品。 条评价
★★★★★
32 条评价
J
Used this for a manufacturing quality control report, the defect rate Pareto charts, cause-effect diagrams, and Six Sigma tools were perfect.
A
The checkmark and X icons are clear but the green/red colors are harsh on the eyes.
S
I like the control chart with upper/lower limits, saved me from building in Excel.
H
The process map symbols are standard but some are missing (like inspection points).
E
A solid template for engineers, though the slide master is a bit messy to edit.
常见问题
可以在 Google 幻灯片中使用吗?
可以。导入后部分动画可能需要重新设置,但形状和颜色都会保留。
字体是否已嵌入?
模板使用 Calibri(系统自带)和 Inter(开源字体)。Inter 已包含在 ZIP 压缩包中,安装一次即可。
可以用于客户项目吗?
可以。商业许可涵盖无限数量的客户项目,仅禁止转售或分发模板文件本身。
退款政策是什么?
如果文件无法打开或与本页预览不符,可在 14 天内申请退款。请发送邮件至 [email protected] 并附上订单号。
购买后模板会更新吗?
会。此模板今后的所有更新均免费,新版本发布时您会收到邮件通知。



全部 1 张幻灯片