Asia Map PowerPoint Template - Fully Editable & Professional Maps


Type: PowerPoint Maps template
Category: Asia
Sources Available: .pptx
Product ID: PM00026
Template incl.: 37 editable slides
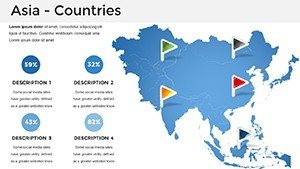
High-Impact Visuals for Strategic Asian Market Presentations
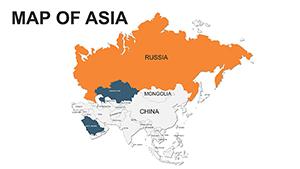
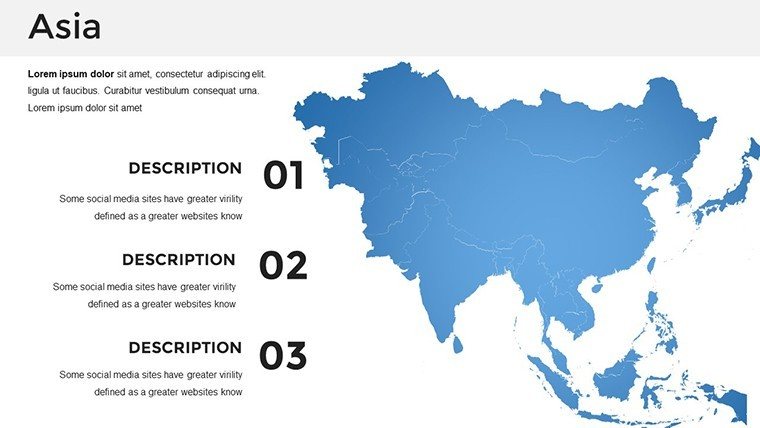
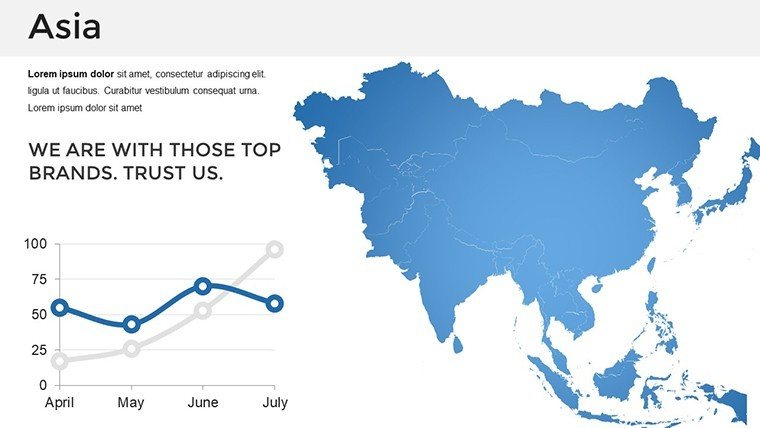
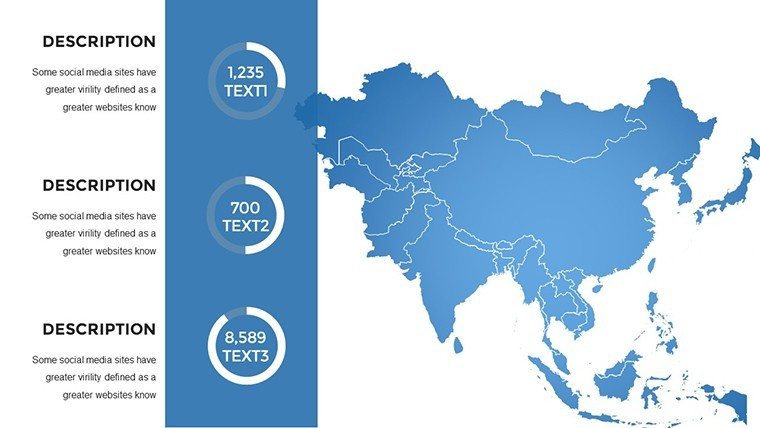
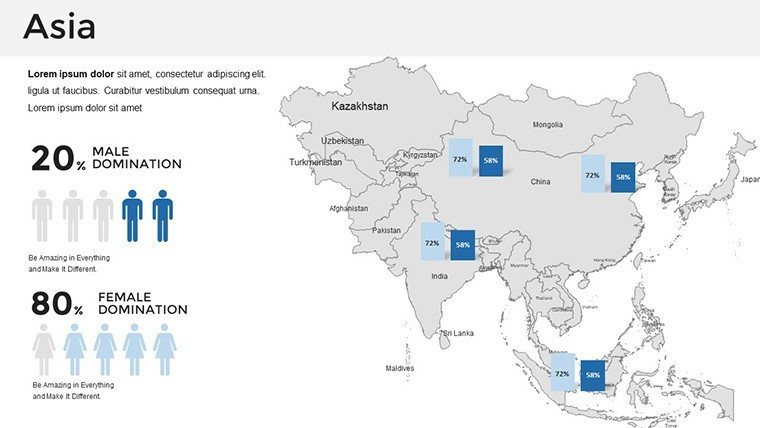
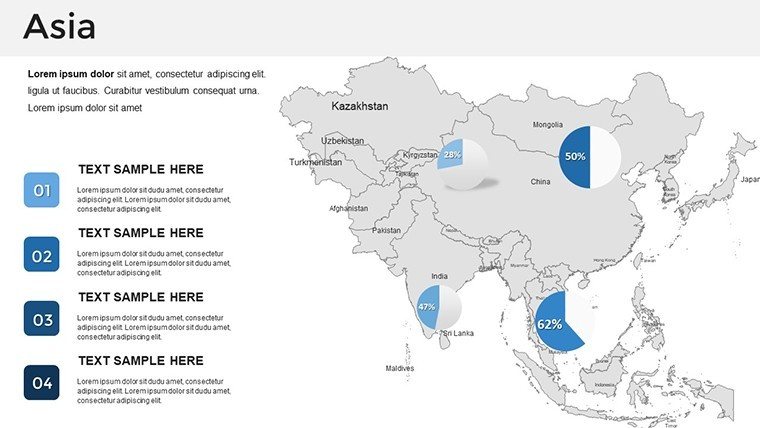
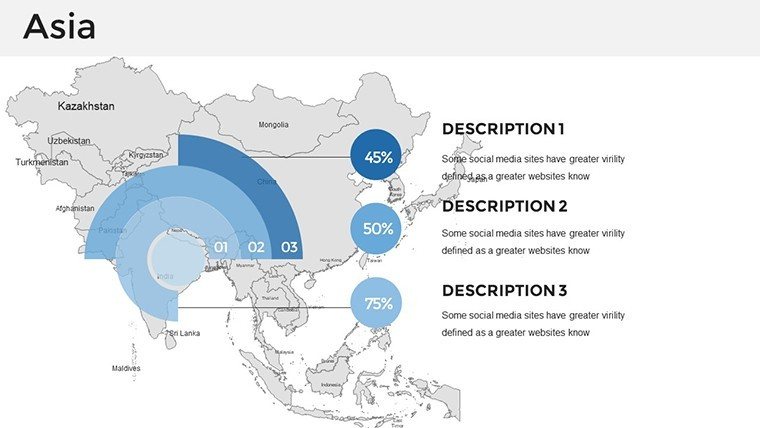
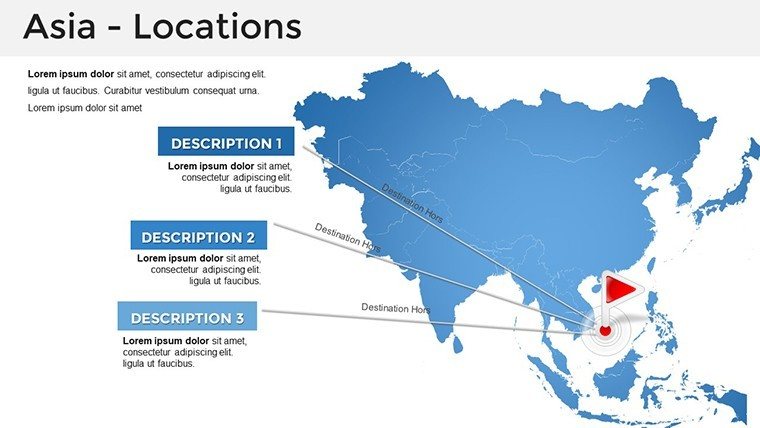
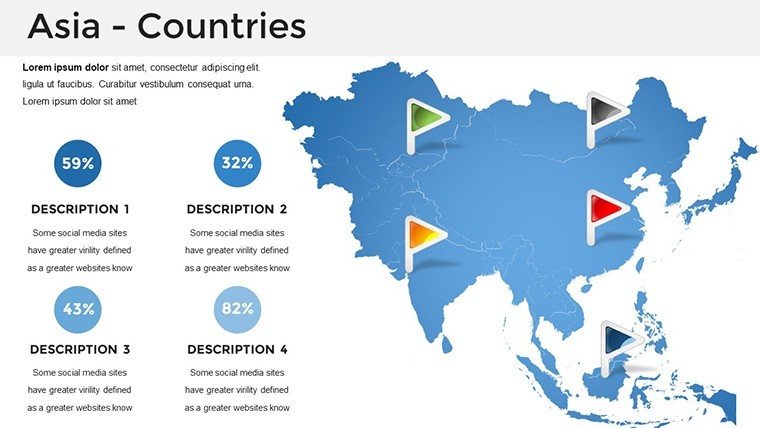
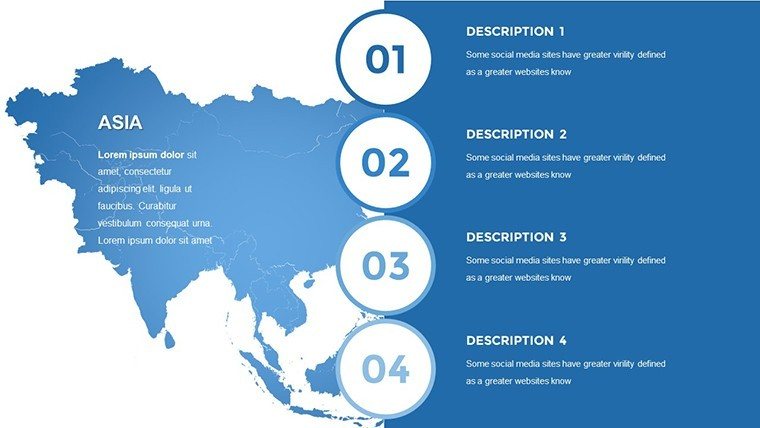
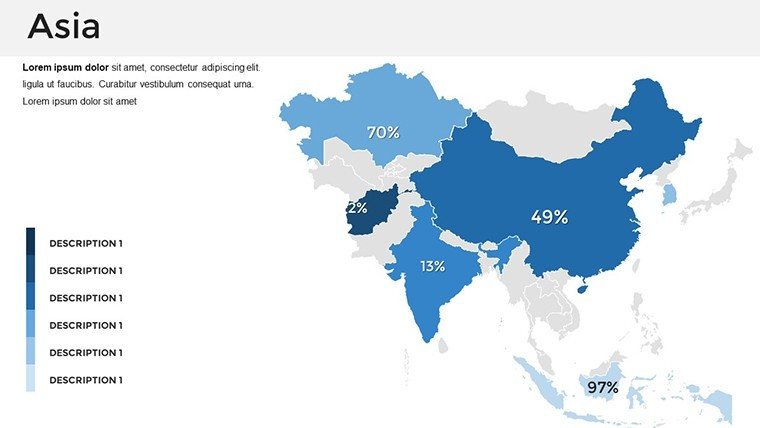
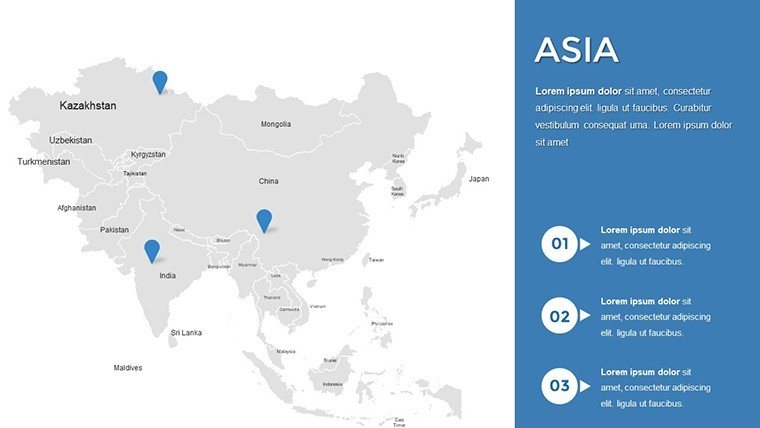
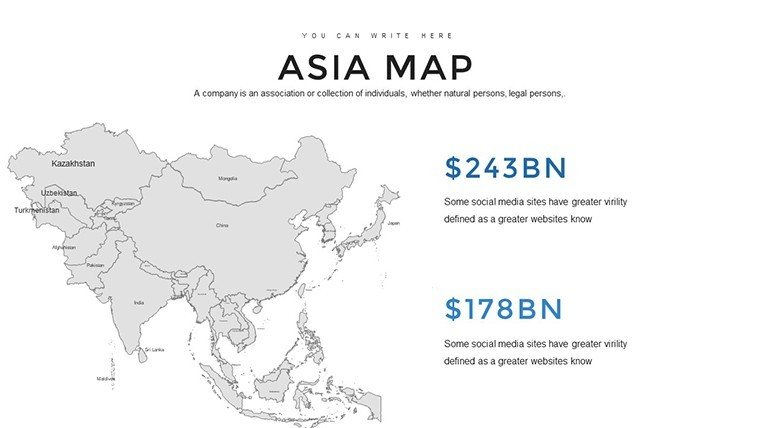
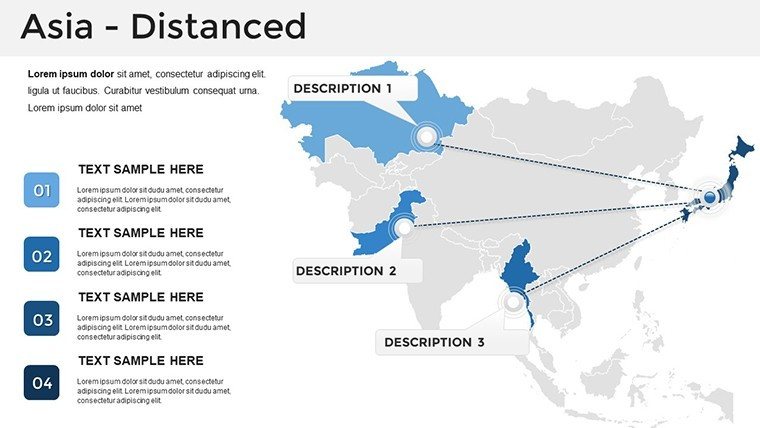
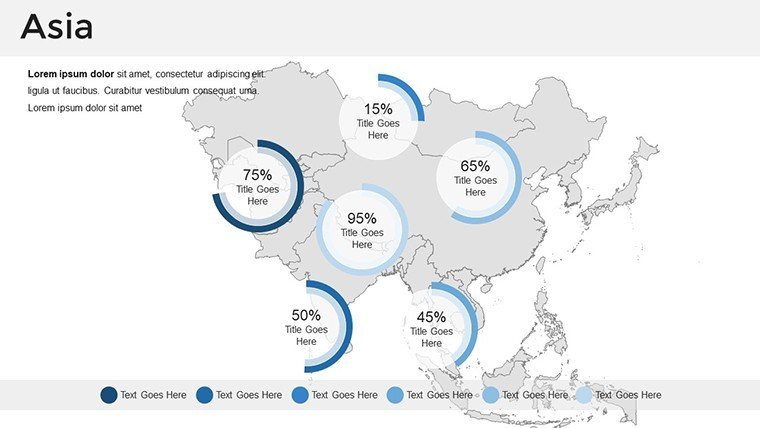
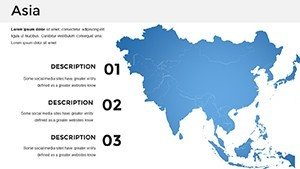
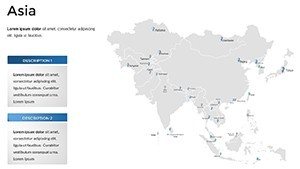
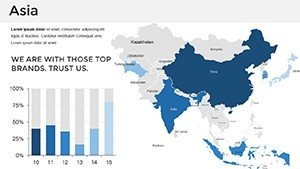
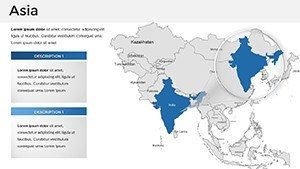
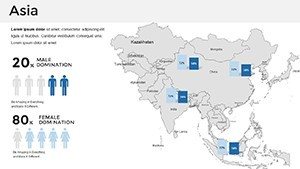
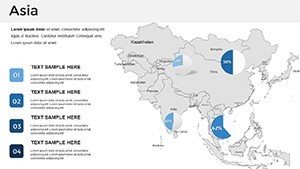
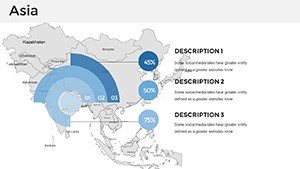
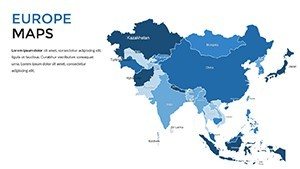
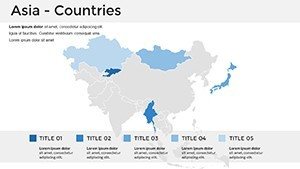
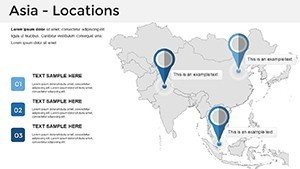
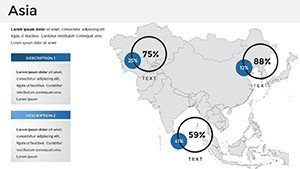
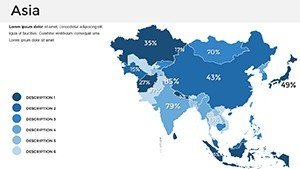
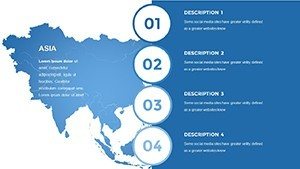
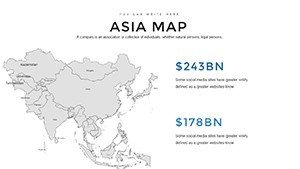
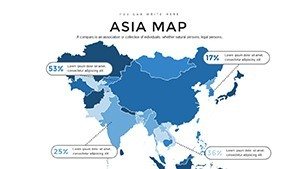
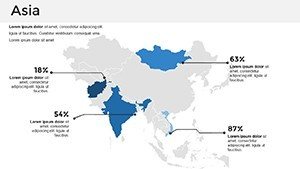
Presenting geographical data across the Asian continent requires more than just a static image; it demands a flexible tool that reflects real-time business needs. Our Asia Map PowerPoint template provides 37 professionally designed slides, each engineered for executive-level communication. Whether you are outlining supply chain routes, regional sales territories, or demographic shifts, these vector-based maps allow for precise customization of every country and region.
Why Professionals Choose Our Asia Map Templates
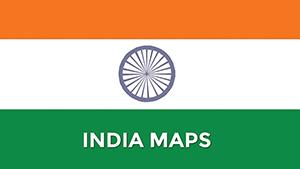
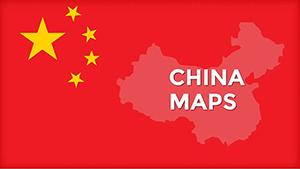
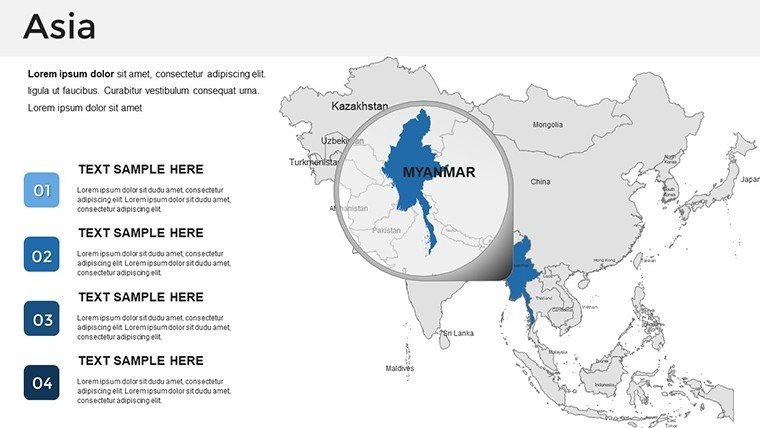
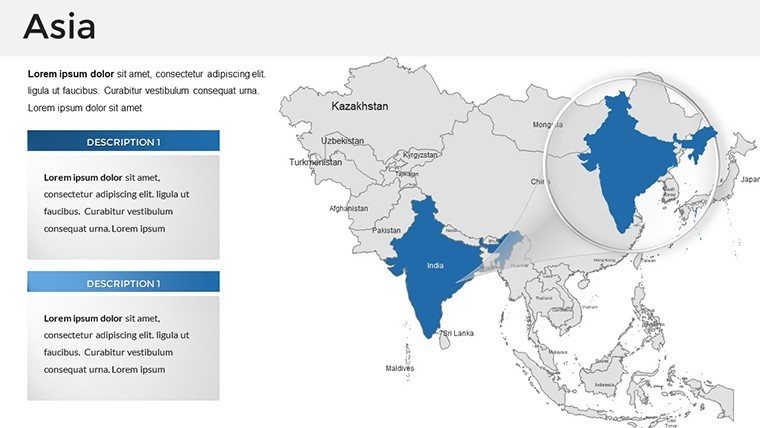
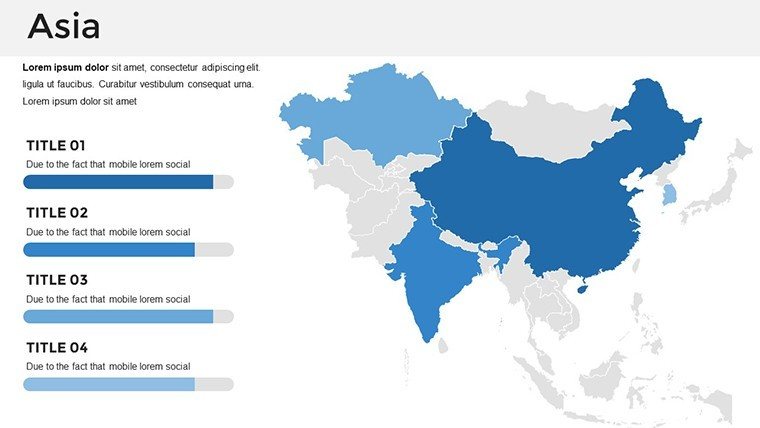
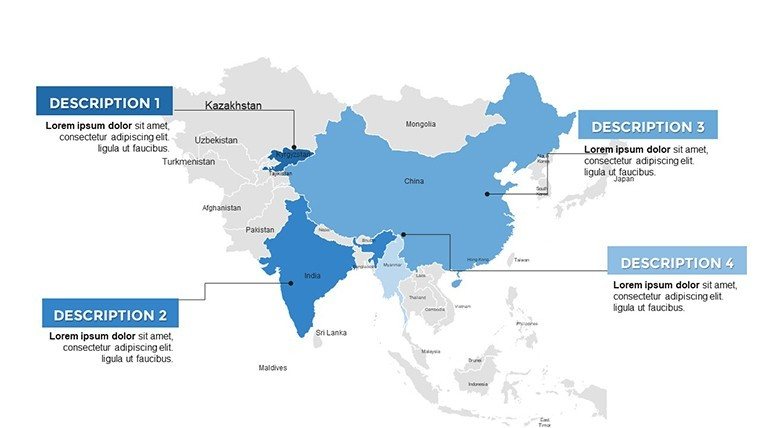
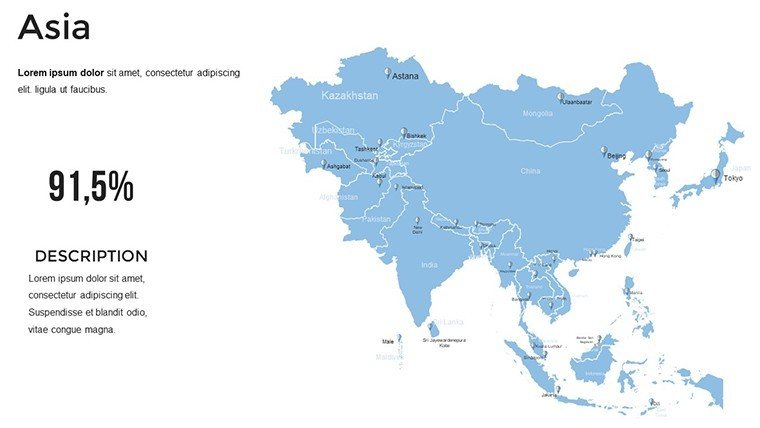
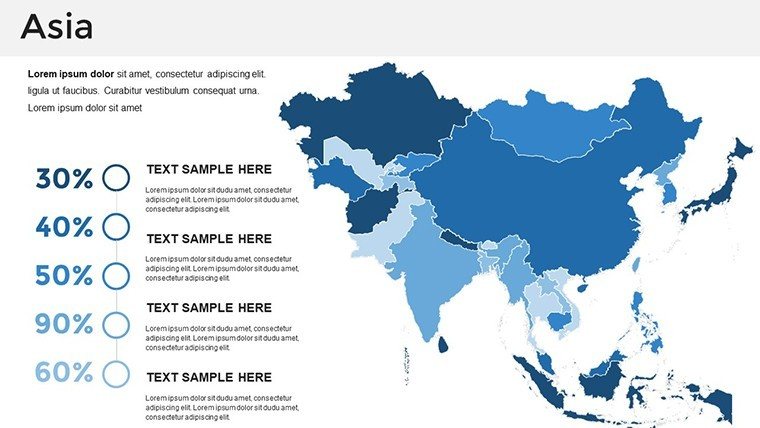
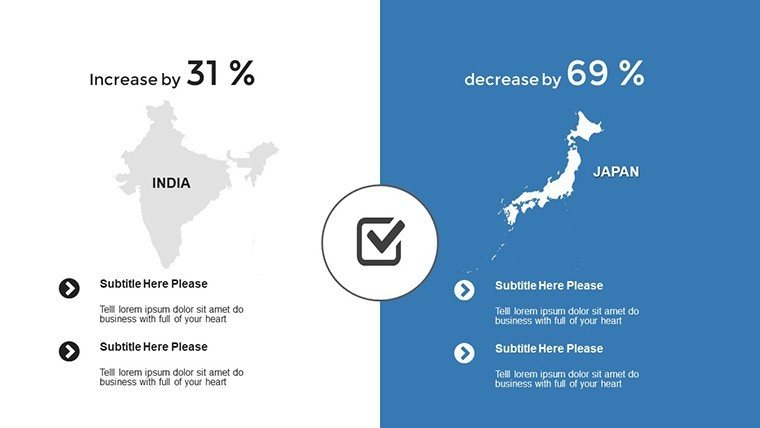
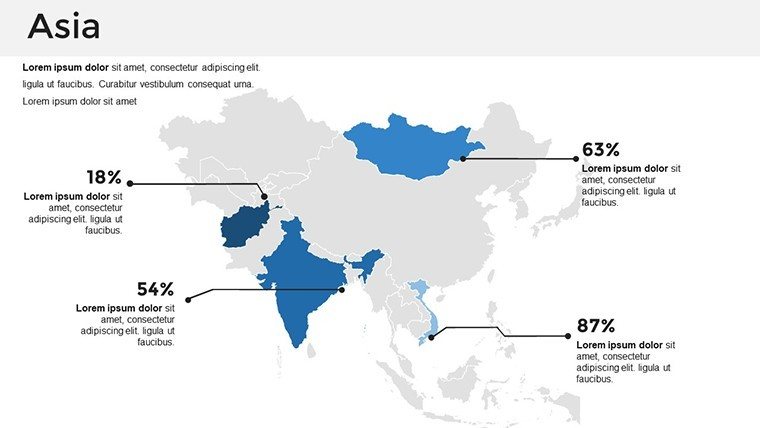
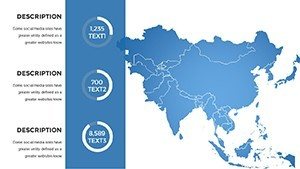
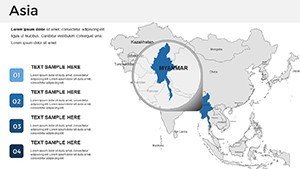
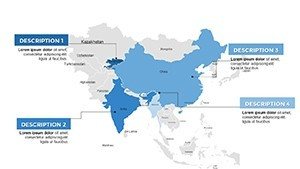
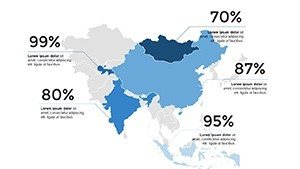
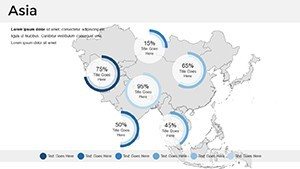
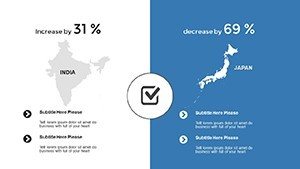
- Full Customization: Change colors, resize borders, and highlight specific countries like India, China, or Japan without losing image quality.
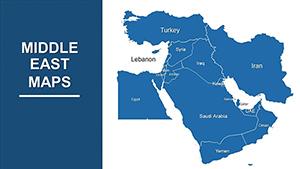
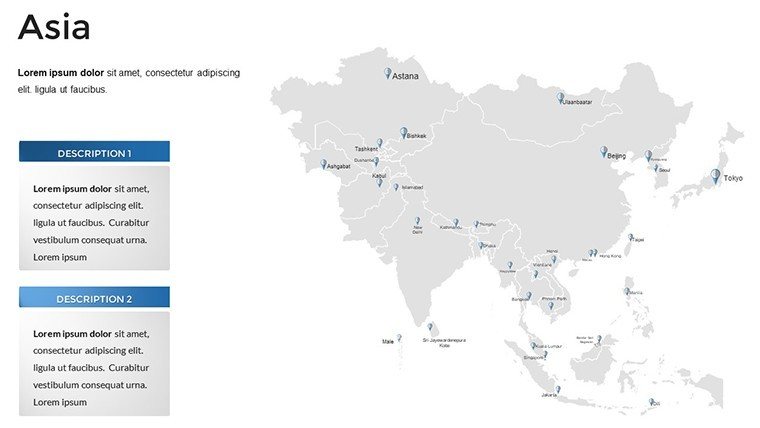
- Comprehensive Regional Coverage: Includes detailed breakdowns of East Asia, Southeast Asia, Central Asia, and the Middle East.
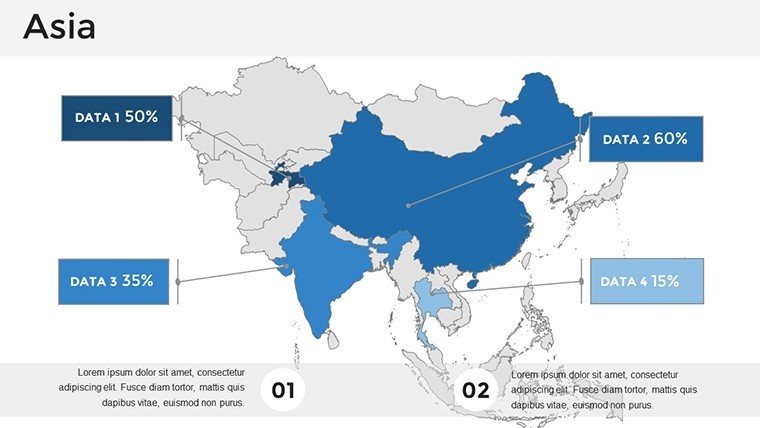
- Professional Use Cases: Perfect for consulting reports, investment pitches, academic lectures, and international logistics planning.
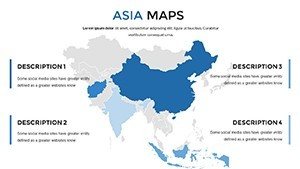
Each slide is optimized for clarity, ensuring your audience remains focused on the data rather than struggling with cluttered visuals. From market entry strategies to geopolitical analysis, these maps serve as a foundational element for any high-stakes presentation. Get Instant Access to 37 Professional Slides
Frequently Asked Questions
Can I change the color of individual countries in the Asia map?
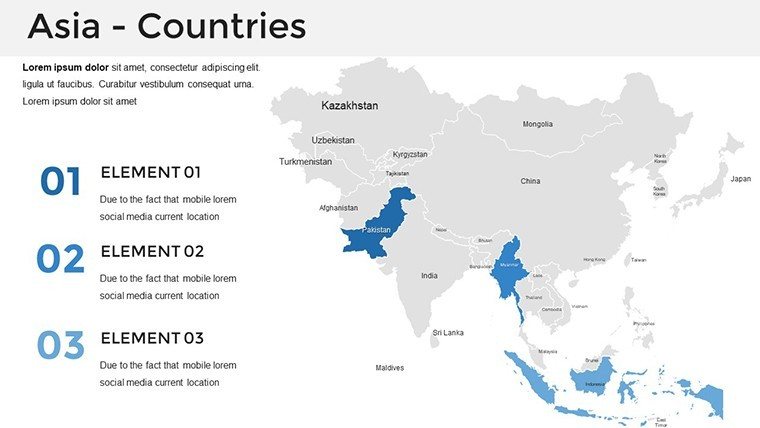
Yes, every country and region in this PowerPoint template is a separate vector object. You can select individual areas and apply your corporate brand colors, outlines, or highlight specific territories to emphasize regional data.
Is this Asia map template compatible with Google Slides?
Absolutely. While optimized for Microsoft PowerPoint (.pptx), you can easily upload this file to Google Drive and open it with Google Slides. All editable elements remain functional, allowing for collaborative team editing.
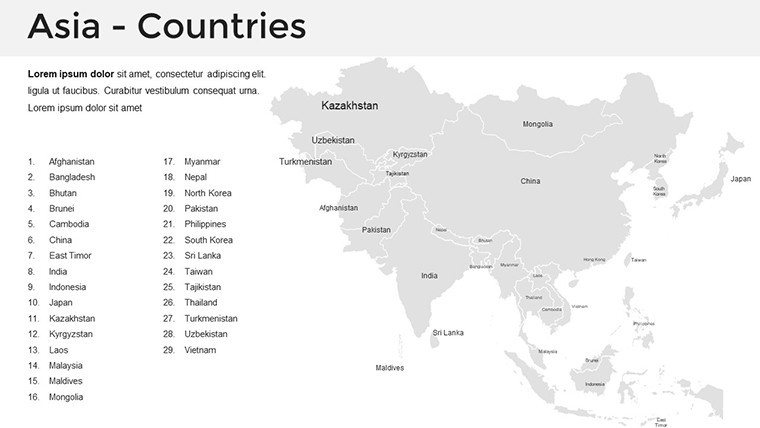
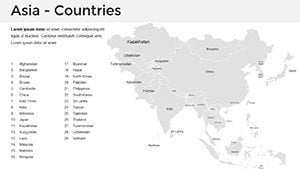
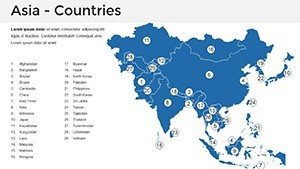
What countries are included in this map set?
The template includes all major Asian countries, including China, India, Japan, South Korea, Indonesia, Vietnam, and Thailand, along with regional maps for the Middle East and Central Asia.