 Click to zoom
Fats and Oils PowerPoint Charts Template - Nutrition Data Visualization Slides | Fully Editable | Instant Download
| Format | .pptx |
| Slides | 59 unique layouts |
| Aspect ratio | 16:9 |
| Compatibility | PowerPoint |
| Animated | No |
| Language | English |
| License | Commercial |
| File size | — |
| Version | v1.0 |
| Last updated | February 2026 |
What's inside
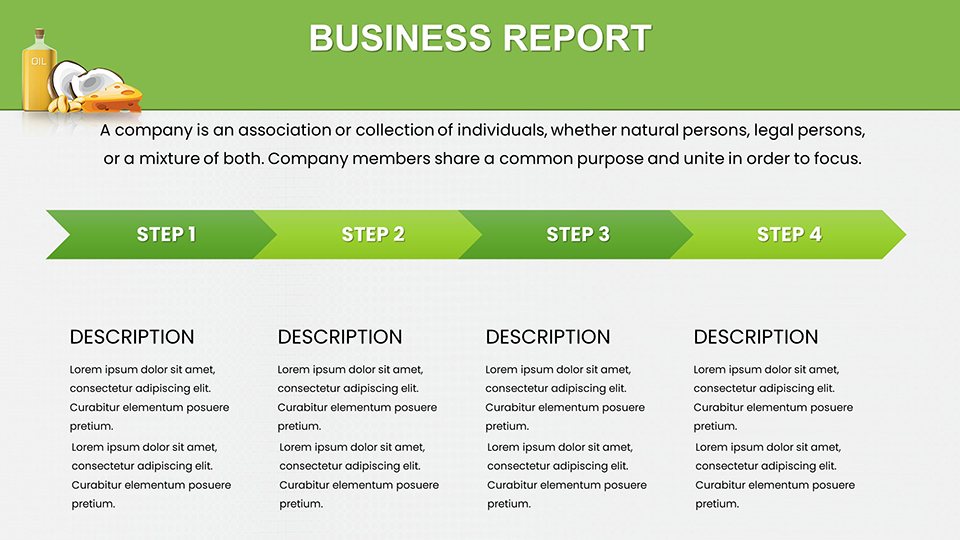
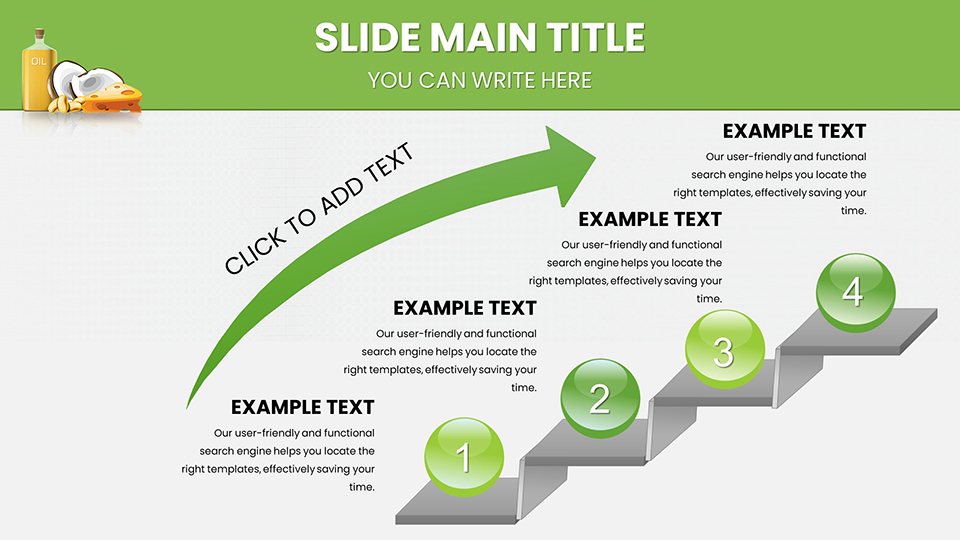
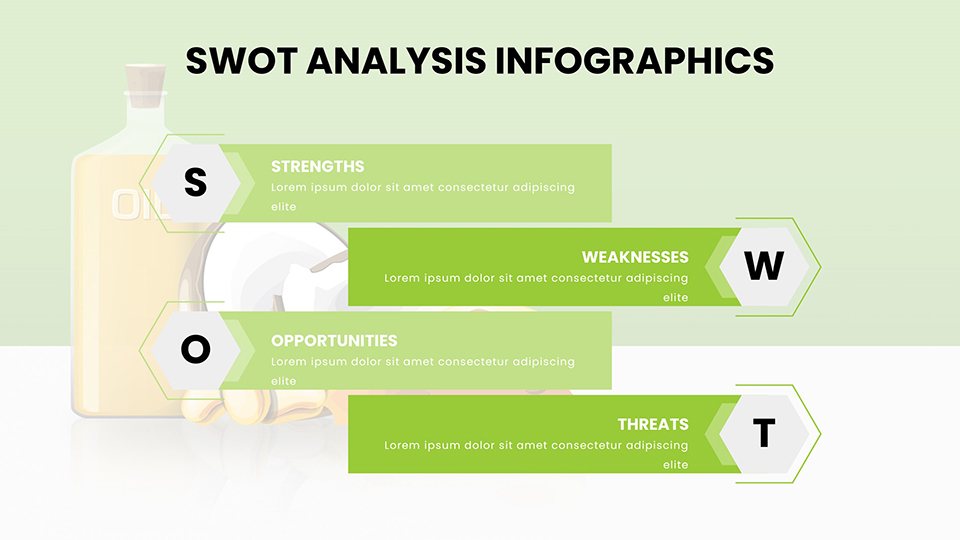
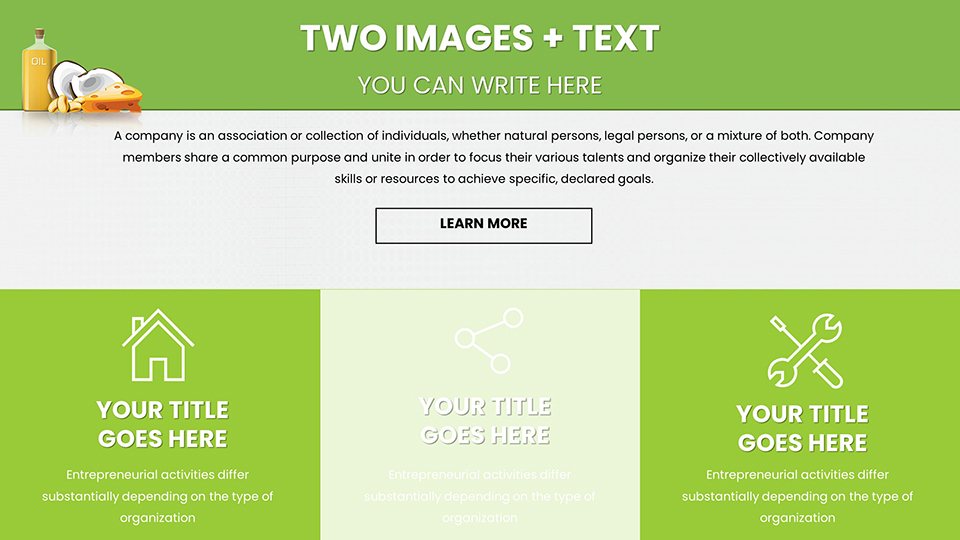
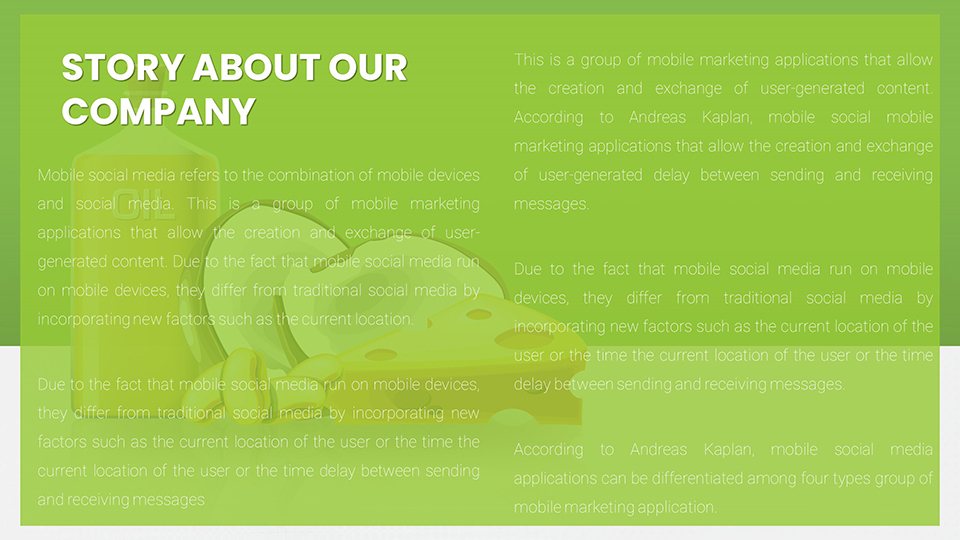
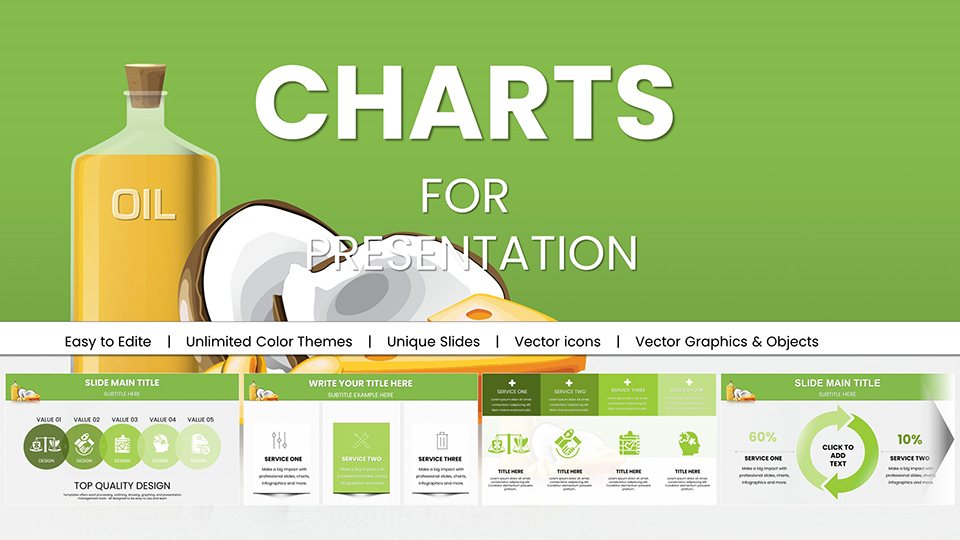
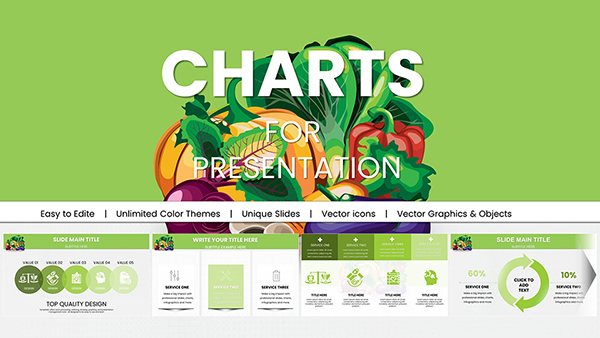
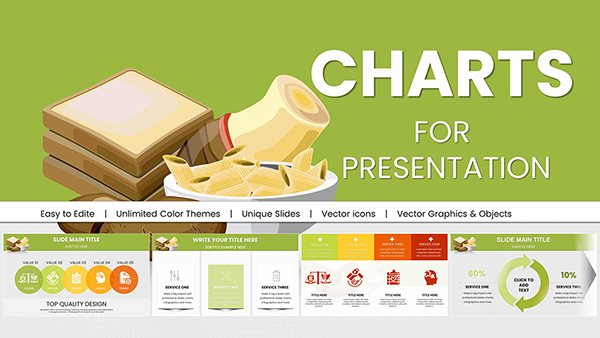
Present complex information on fats and oils using 59 professional PowerPoint chart slides. Ideal for nutritionists, dietitians, health educators, and food industry reports. Features pie charts for saturated vs unsaturated fats, bar graphs, line trends, and more. Instant download.
When it comes to discussing the intricate world of dietary fats and oils, clarity and engagement are essential to cut through the misinformation fog. Our Fats and Oils PowerPoint Charts Template provides 59 meticulously designed, editable slides that turn dense nutritional data into digestible, eye-catching visuals.
Benefits for Nutrition Presentations
This template solves the problem of presenting complex nutrition data on saturated versus unsaturated fats, omega-3 benefits, trans fats, and health impacts in a way that engages audiences and improves retention. It is tailored for real-world use by professionals who need science-based visuals aligned with USDA, WHO, and American Heart Association guidelines.
Ideal Professional Scenarios
Nutritionists use it during client sessions to explain omega-3 benefits. Health educators apply it in workshops to demystify trans fats. Food industry experts employ it when pitching sustainable oil alternatives or reformulation case studies. Corporate wellness programs and conference researchers rely on the charts for data-driven storytelling.
Chart Types Included
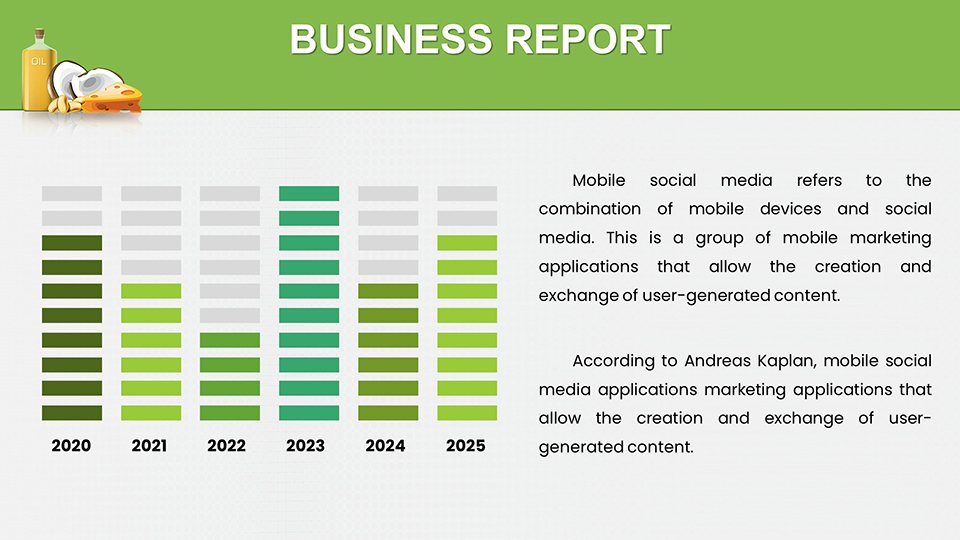
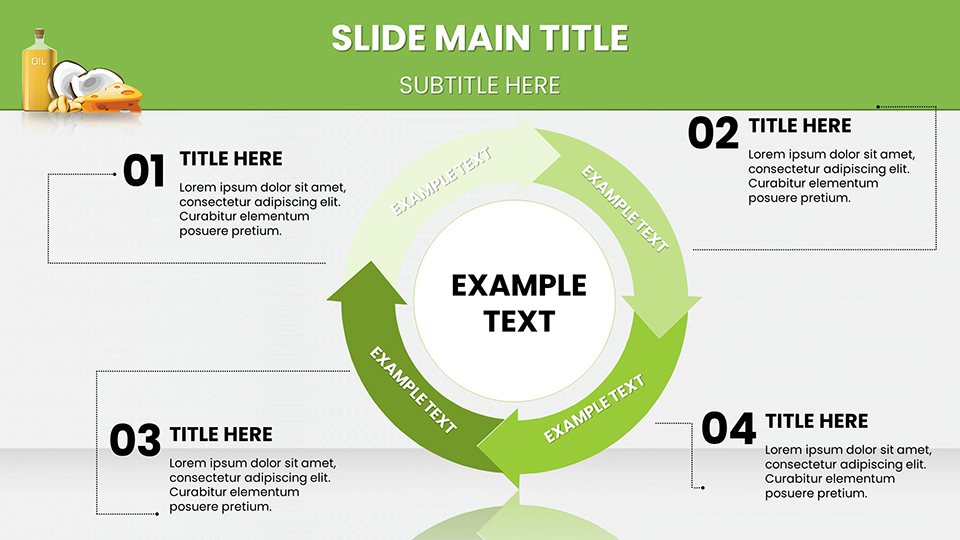
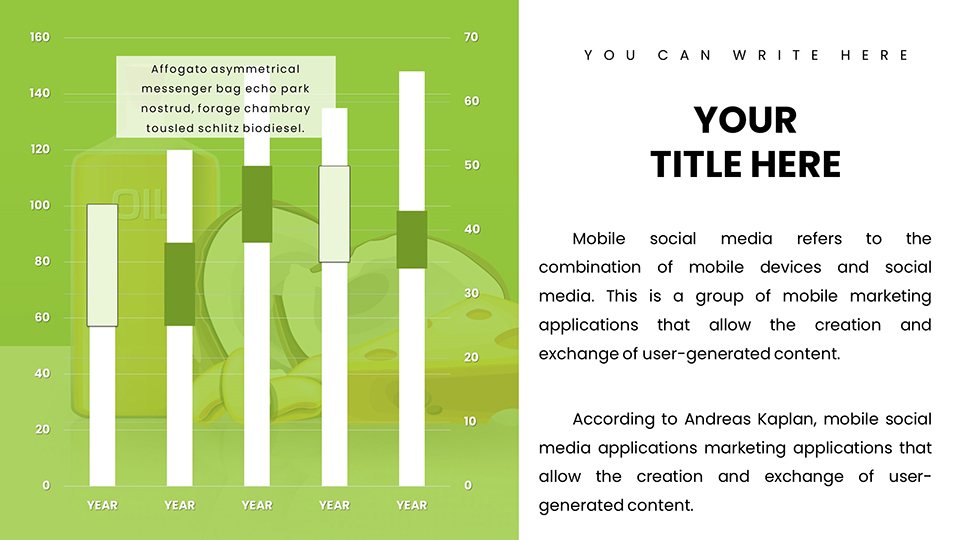
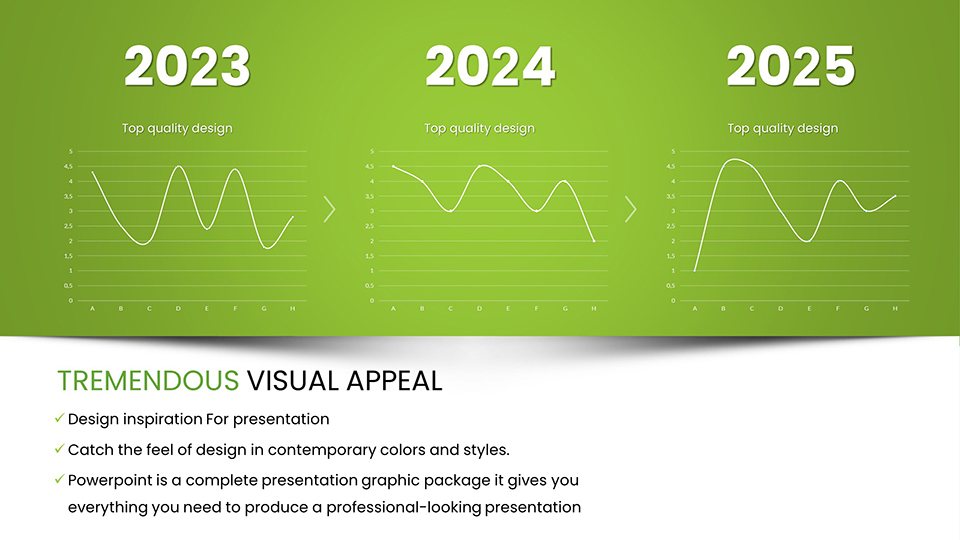
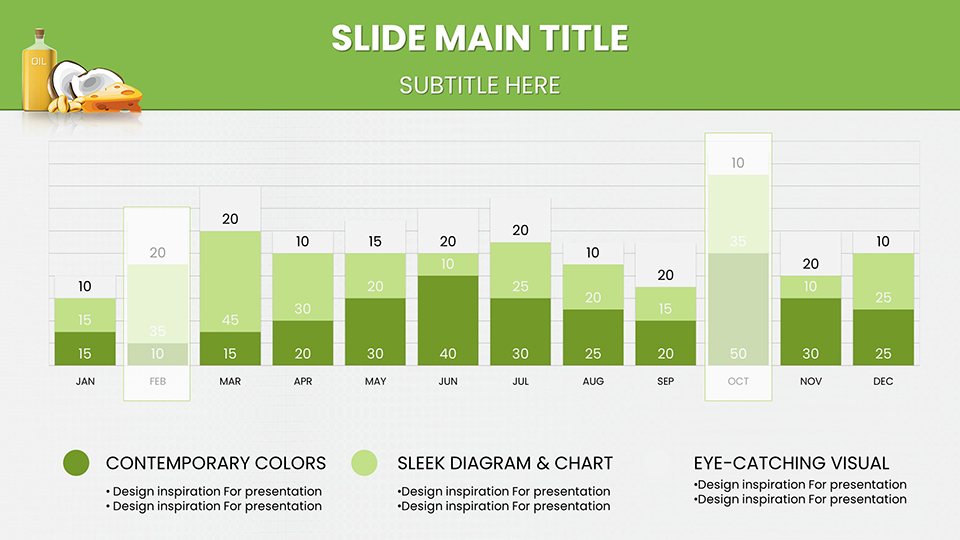
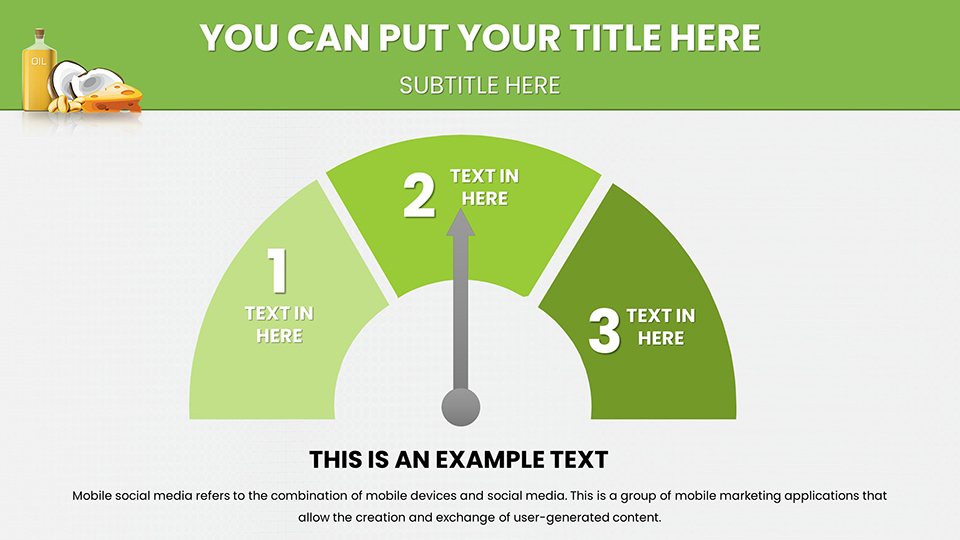
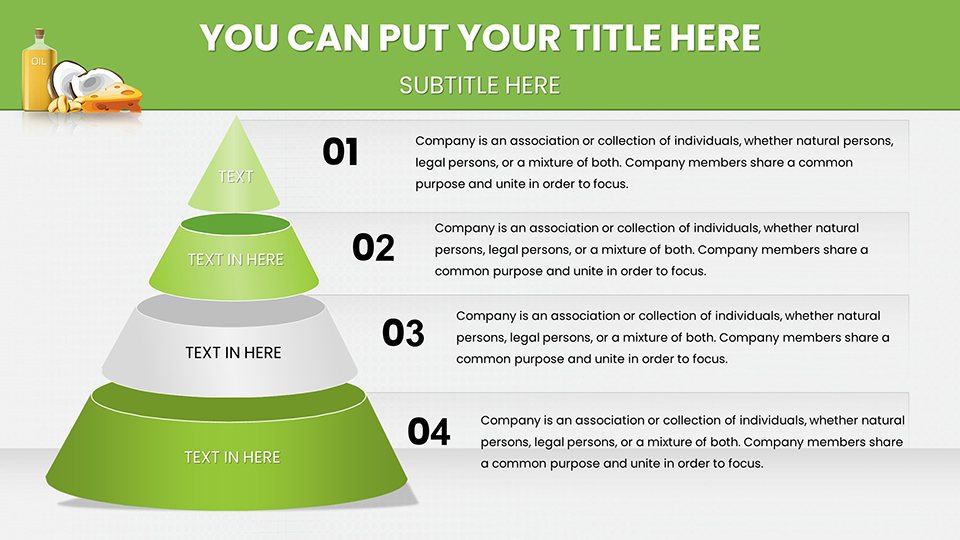
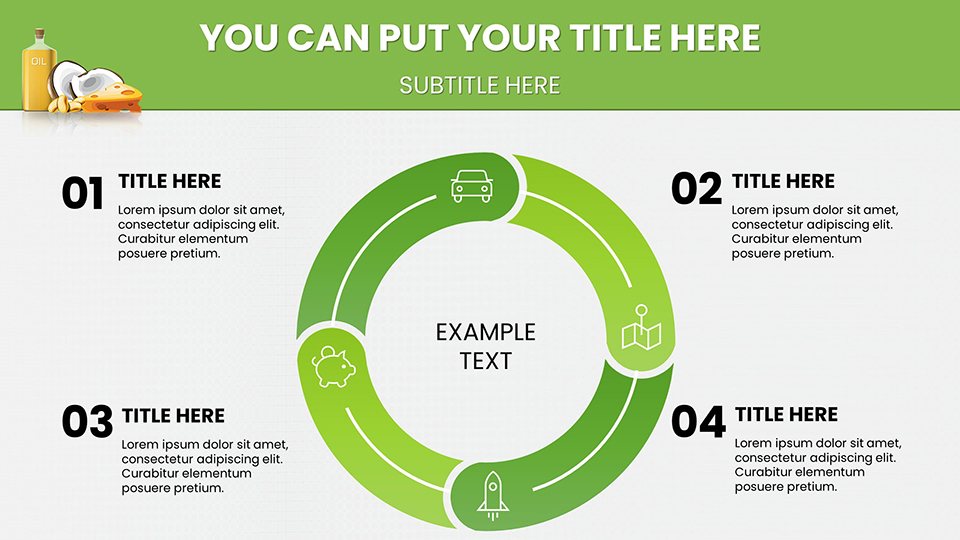
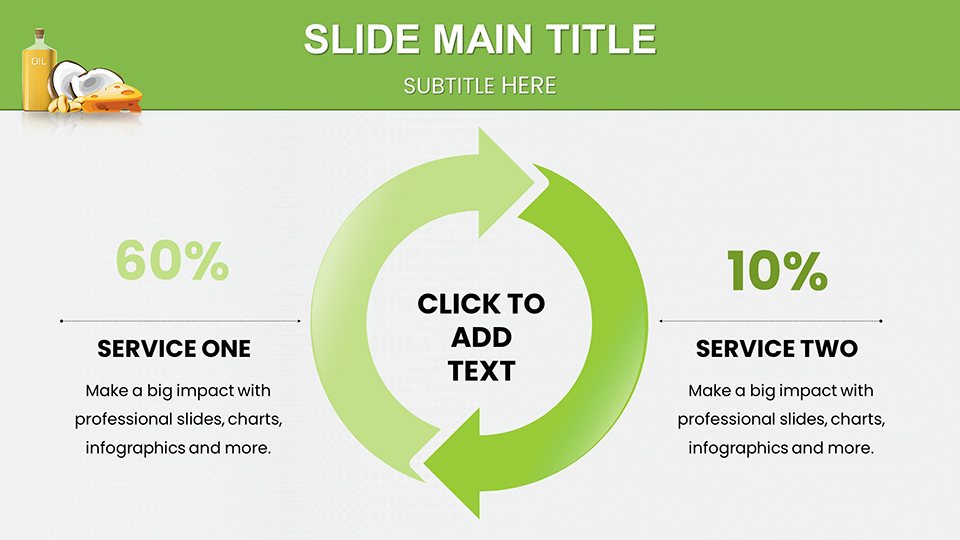
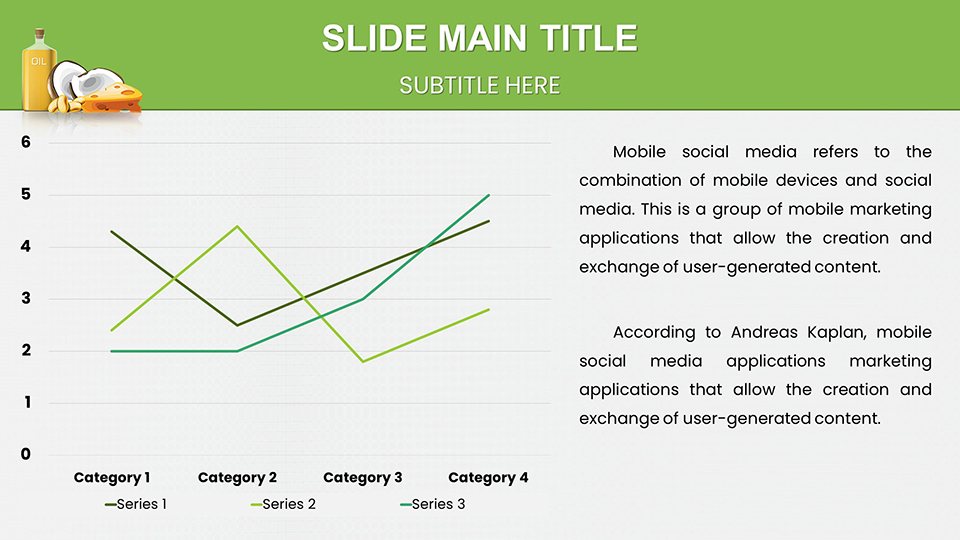
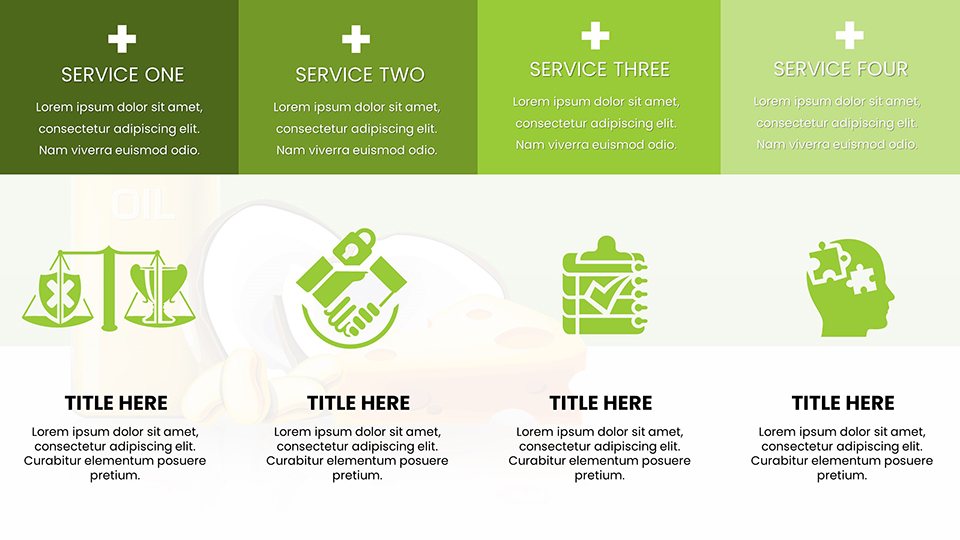
The slides feature pie charts breaking down saturated vs unsaturated fats in common foods, bar graphs comparing calorie densities, line charts tracking oil consumption trends, histograms of fatty acid profiles, and scatter plots illustrating health correlations.
How to Use the Template
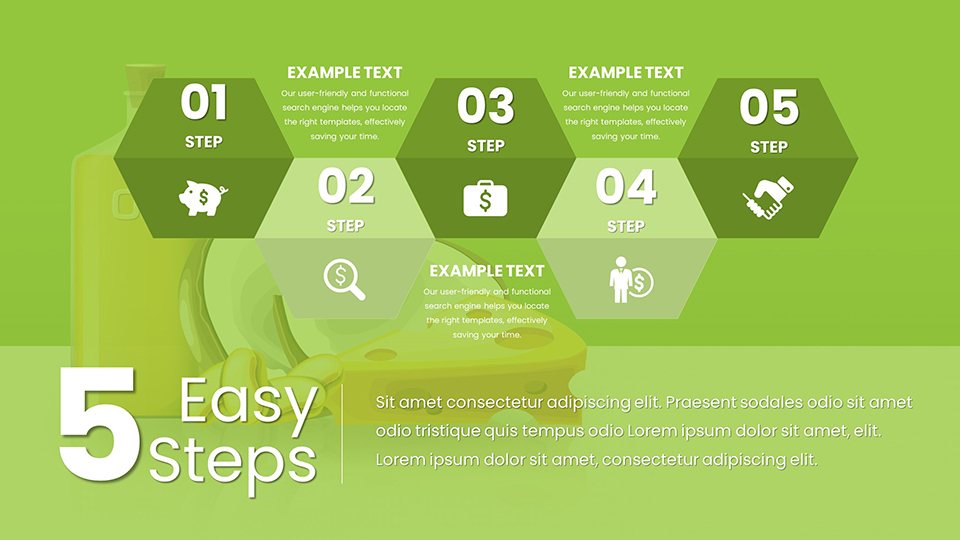
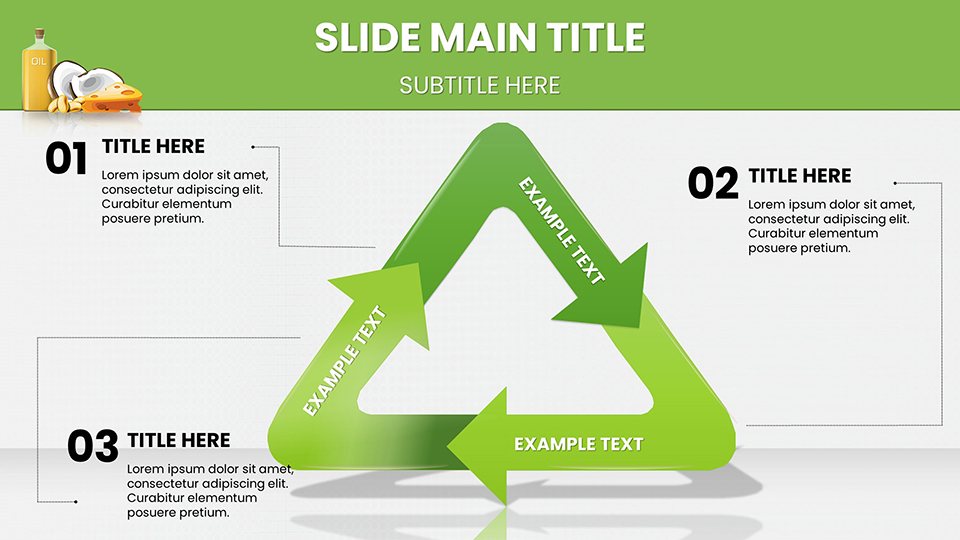
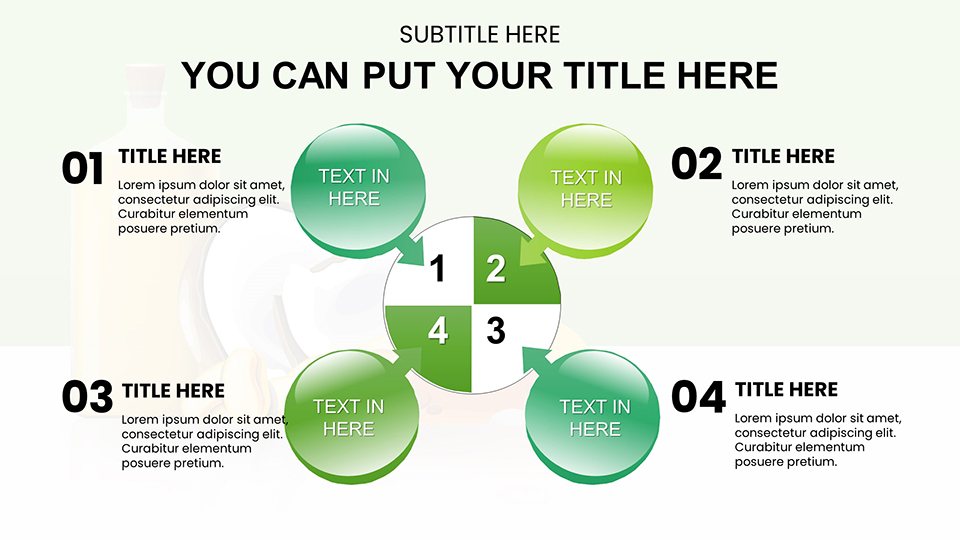
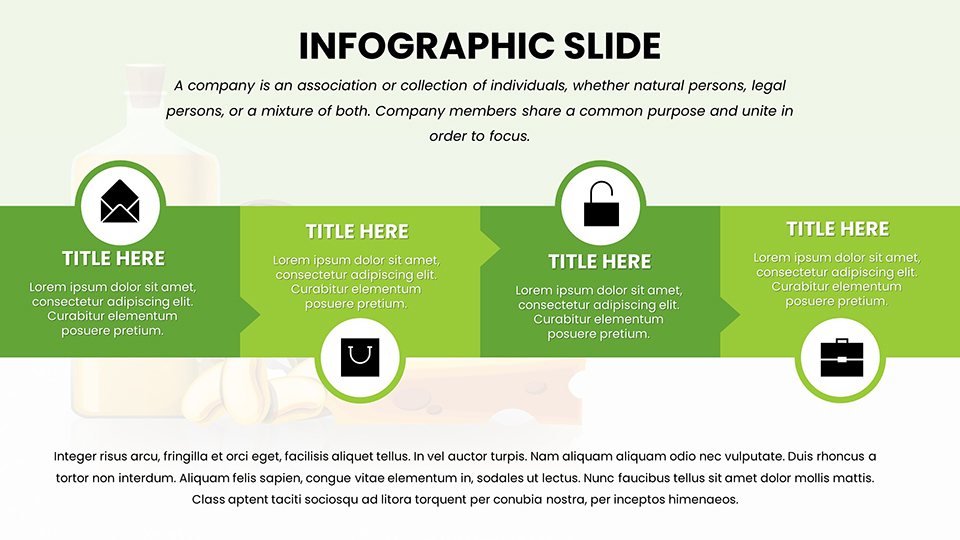
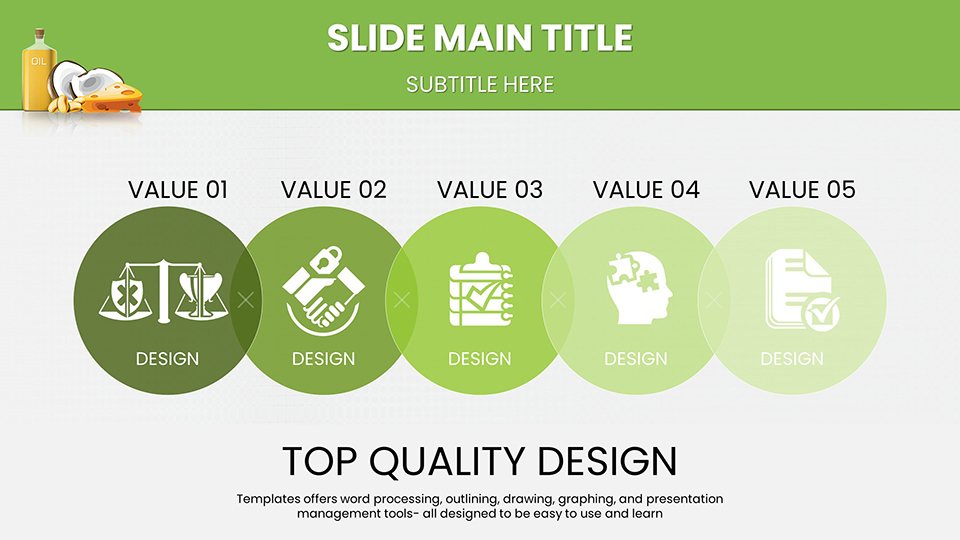
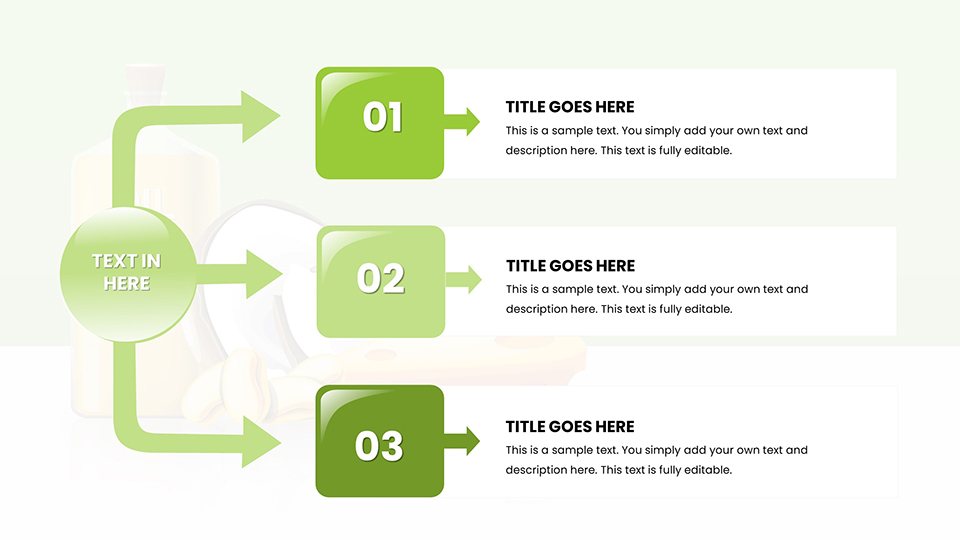
Download the .pptx file and open in PowerPoint or Google Slides. Drag-and-drop your Excel data into the editable charts. Adjust colors, icons like oil droplets or lipid chains, and fonts to match your branding. The 59 slides cover overviews, deep dives, and summaries so you can build a complete deck in minutes.
Key Advantages
Fully scalable vector elements ensure crisp output for any screen or print. Branding integration and data import simplicity speed up customization. The professional design builds credibility while helping audiences grasp lipid metabolism, dietary guidelines, or vegan trends quickly.
How many slides are in the template?The template includes 59 fully editable slides covering various chart types and layouts for comprehensive nutrition presentations.
Is it compatible with Google Slides?Yes, the .pptx format works seamlessly with Google Slides.
Can I change the chart data easily?Absolutely. Charts are linked to editable data tables allowing quick updates with your own numbers.
Who is this template designed for?Nutritionists, dietitians, health educators, wellness coaches, and food & beverage industry professionals.
Good for
- Project roadmaps and sprint plans
- Product launch timelines
- Quarterly or annual review decks
- Company history and milestone summaries
Licence
reviews
Used for wild law business compliance. The rights of nature charts showed legal evolution.
Earth jurisprudence design with rights-based visualization.
Everything aligned with some precedent case integrations requiring space.
Helped align business with living systems law.
FAQ
Will it work in Google Slides?
Are fonts embedded?
Can I use this for client work?
What's the refund policy?
Do you update the template after purchase?
Similar templates
See all PowerPoint Charts →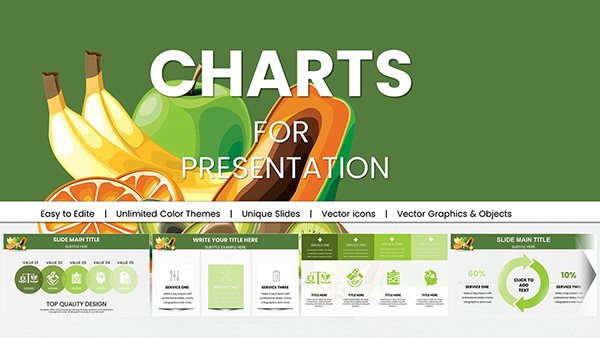

All 59 slides