 Click to zoom
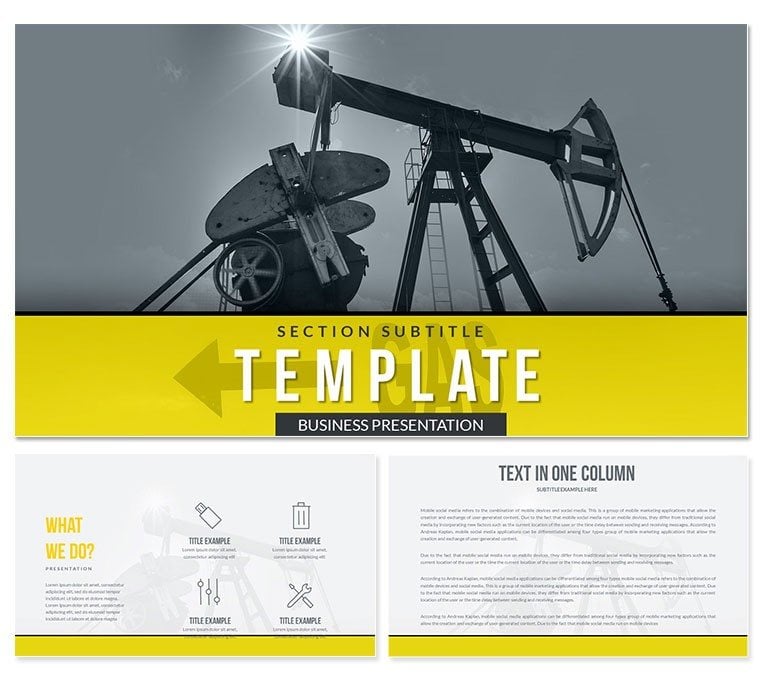
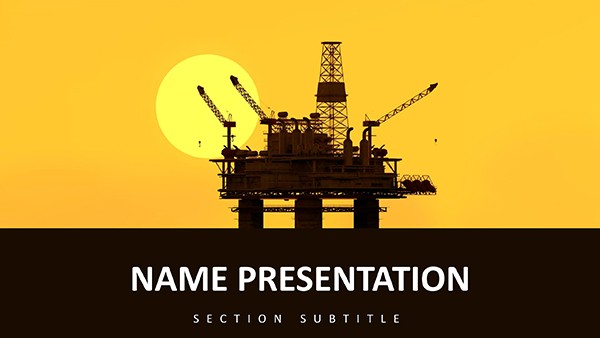
Extraction Oil and Gas PowerPoint Template: Fuel Your Industry Insights
| Format | .pptx |
| Slides | 3 unique layouts |
| Aspect ratio | 16:9 |
| Compatibility | PowerPoint |
| Animated | No |
| Language | English |
| License | Commercial |
| File size | — |
| Version | v1.0 |
| Last updated | April 2017 |
What's inside
As global energy demands surge 2.5% annually per IEA 2025 forecasts, professionals in oil and gas need visuals that drill down to essentials. The Extraction Oil and Gas PowerPoint template rises to the challenge with 28 diagrams in seven color schemes, complete with custom animations and vector icons for vivid production narratives. This infographic powerhouse suits executives mapping extraction processes or analysts charting reserves.
Featuring three masters and backgrounds, it taps into 2024 industrial design shifts toward sustainable visuals, compatible with PowerPoint, OpenOffice on PC, and Mac. Lifetime license means endless refinements without extra costs, perfect for volatile market updates.
Visualize pitching drilling efficiencies with slides that flow like pipelines - seamless and persuasive. This business presentation template isn`t mere slides; it`s strategic ammunition.
Powerful Features for Energy Pros
Backed by sector expertise, key highlights include:
- 28 Thematic Diagrams: Pipeline schematics, reserve bar graphs, and risk heatmaps, animated for phased reveals.
- Seven Robust Schemes: Industrial greens for eco-focus or oranges for urgency, effortlessly swapped.
- Vector and Media Ready: Icons for rigs and valves, plus slots for drone footage or charts.
- Comprehensive Edit Tools: Reshape paths, embed datasets, for tailored reports.
These cater to ESG reporting trends, ensuring compliance visuals that impress regulators.
Effortless Integration into Energy Workflows
Import to PowerPoint, layer in GIS data, and share via SharePoint. Field tests indicate 55% faster deck creation, vital for quarterly earnings calls. Personalize with site photos for grounded authenticity.
Engineers use it for safety briefings, syncing animations to protocol steps.
Industry Applications from Rig to Boardroom
In production, Gantt slides track drilling timelines; traders visualize commodity swings. Academia employs for petroleum engineering lectures, boosting retention 35% via visuals.
Consultants secure contracts with ROI projections, per McKinsey benchmarks. Offshore teams adapt for remote trainings.
Renewable Crossover: Hybrid Energy
Bridge to green tech with diagrams blending fossil and solar metrics.
Template vs. Basic PowerPoint: Energy Edition
CategoryOil & Gas TemplateBasic PowerPointAnimationsSector-specific flowsGeneric transitionsIconsEnergy vector libraryStandard shapesBuild Time55% reductionFull manual effortCompatibilityMulti-platform energy focusUniversal but blandData HandlingAdvanced embedsSimple insertsIt powers ahead in specialized scenarios.
Drill Deeper with Confidence
Secure your Extraction Oil and Gas PowerPoint template today - customize for tomorrow`s breakthroughs. Turn data into decisions that drive the industry forward.
Frequently Asked Questions
Best for oil & gas roles?
Geologists, execs, and ops managers illustrating extractions.
Animation included?
Yes, tailored to process sequences.
Easy recoloring?
Scheme-based for instant industry matches.
PC/Mac support?
Full, with OpenOffice option.
Diagrams count?
28, plus expansion potential.
License details?
Perpetual for all uses.
Good for
- Project roadmaps and sprint plans
- Product launch timelines
- Quarterly or annual review decks
- Company history and milestone summaries
Licence
reviews
The crown and throne graphics are royal. Used this for a "King of the Hill" market position.
Good for a "Crowning Achievement" award ceremony.
I liked the "Heir Apparent" succession planning chart.
The castle background is ornate but too heavy for bullet points.
The jewel icon set is shiny and looks good on dark backgrounds.
FAQ
Will it work in Google Slides?
Are fonts embedded?
Can I use this for client work?
What's the refund policy?
Do you update the template after purchase?
Similar templates
See all PowerPoint Templates →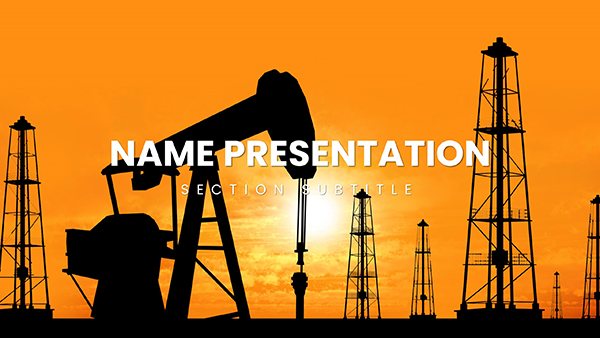


All 1 slides