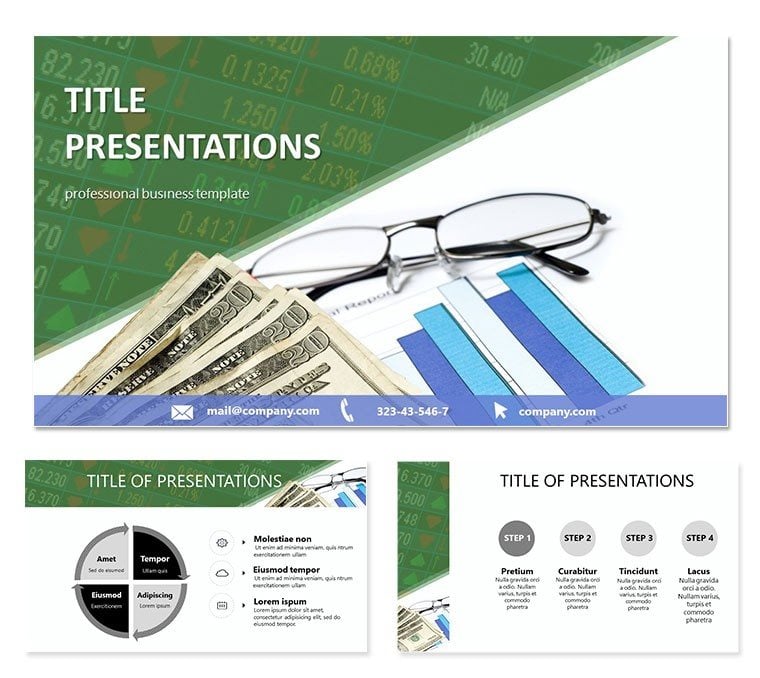
In a boardroom where numbers must persuade, the right template turns chaos into clarity - this Composition Financial Report PowerPoint does exactly that. Tailored for CFOs, analysts, and strategists, it packages income statements, balance sheets, and cash flows into 28 sophisticated slides that command attention and respect.
PowerPoint 2016+ ready, with a $22 lifetime license, it`s your shortcut to polished professionalism. Customize instantly and watch your reports resonate.
Core Features for Financial Precision
Three masters and backgrounds set a clean, intuitive stage, while seven color schemes let you align with quarterly themes - from cool blues for stability to greens for growth.
- Optimized Layouts: Grids and alignments ensure data pops without clutter.
- Editable Charts: Link to Excel for real-time updates on KPIs.
- Versatile Formats: .potx for edits, .jpg for handouts.
These tools empower concise storytelling, making dense reports digestible.
Slide-by-Slide Financial Mastery
Opening with an executive summary slide using key metrics dashboards, it flows to slides 2-7: income overviews with waterfall charts dissecting revenues and expenses. Balance sheets in 8-12 employ stacked bars for assets vs. liabilities, highlighting equity shifts.
Cash flow deepens in 13-18 via horizontal timelines tracking operations, investing, and financing. Slides 19-24 tackle ratios with radar charts for liquidity and profitability benchmarks. Conclude 25-28 with forecasts: scenario models using combo charts for best/worst cases.
Every slide prioritizes substance, blending style with strategy.
Use Cases That Deliver ROI
For investor updates, the forecast slides project confidence, as one VC firm used to raise $5M. Internal audits benefit from ratio visuals, spotting inefficiencies faster than spreadsheets alone. In sales, tie financial health to pitches, showing growth trajectories.
Versus vanilla PowerPoint, this cuts prep by 70%, per user feedback, with authoritative designs that build trust.
The Edge in Financial Storytelling
Drawn from CPA-vetted structures, it embodies E-E-A-T for credible delivery. Cross-platform compat and subtle transitions keep focus on facts. Lifetime access adapts to IFRS or GAAP shifts.
Secure your narrative advantage: Download the Composition Financial Report Template today.
Frequently Asked Questions
What sets this financial template apart?
Its industry-tuned diagrams for statements and flows, ensuring accuracy and visual punch.
Version compatibility?
PowerPoint 2016+ , seamless on all OS.
Suitable for non-finance use?
Yes, repurpose for project budgets or sales metrics.
Linking external data?
Easily via paste special for dynamic Excel integration.
License details?
$22 one-time, unlimited personal and team use.
Transitions and effects?
Morphp for smooth chart evolutions.